Can We Trust Item Response Theory for AI Evaluation? With Three Papers to Read First
Benchmarks now borrow item response theory from school testing to rank models, flag bad questions and build short tests. When there are few models and many questions, are its numbers right? A main paper and three papers to read first.
key idea what the paper found what is lost, or a limit
chapter 1
The question in one picture
Four models, five questions: a response matrix (made-up example) Main paper §2.1
Each row is a model and each column a question. 1 means right. This table is made up.
The usual score is the row average. Models B and C tie at 0.6.
The average treats every question the same. Q1 says nothing about who is stronger, and Q5 points the wrong way. IRT gives each question its own weight.
A benchmark gives the same questions to many models. Each answer is right or wrong. Put the answers in a table with one row per model and one column per question. That table is a response matrix. Main paper §2.1
The usual score is each row's average. It counts every question the same. Main paper §1 Some questions carry no signal about strength, for example one that every model gets right. Main paper §3 The average still counts it in full.
IRT comes from school testing. It gives each model one hidden number and each question a few numbers of its own. Questions then count by how much they tell. Main paper §2.1 AI researchers use it to score models, to find weak questions and to build shorter tests. Main paper §3
The main paper asks whether those IRT numbers are right when the table looks like an AI benchmark: few models and many questions. Main paper Abstract
Four papers, one story
- Leaderboards (2021) fits IRT to a public leaderboard. It ranks models and flags broken questions. Leaderboards Abstract
- TinyBenchmarks (2024) uses IRT to estimate a model's MMLU score from only 100 questions. tinyBenchmarks Abstract
- The main paper (2026) tests whether uses like these give the right numbers. Main paper §1
- OpenEval (2026) argues that every model's answer to every question should be released. Checks like the main paper's need that data. OpenEval Abstract
The answer, in short
The fitted average scores held up. Model rankings and per-question numbers often did not. Rankings broke when the models' strengths were lopsided or few questions matched their level. Question numbers broke with only 30 models. Main paper §6
In the made-up table, models B and C have the same average. Why might IRT still rank them apart?
They got different questions right. B got Q3 right. C got Q5 right, and only the top model also got Q5. IRT weighs each question by how hard it is and how well it separates models. So the same count of right answers can mean different strengths.
What does a row of the response matrix hold, and what does a column hold?
A row holds one model's right and wrong answers on every question. A column holds every model's answer to one question. Main paper §2.1
chapter 2
What you need first
1. Strength and difficulty
The Leaderboards paper explains IRT with two quiz players. Ken is good at trivia and Burt is not. Leaderboards §2 In IRT, each player has a hidden capability, written θ. Each question has a difficulty, written b. Main paper §2.1
The further θ is above b, the more likely a right answer. Leaderboards §2 A model with θ equal to b has a 50% chance in the simplest version. No one sees θ or b. Both are worked out from the response matrix. Main paper §2.1
2. Three IRT models
Three IRT models, from simple to rich Main paper §2.1
1PL: each question has only a difficulty. A model whose θ equals b has a 50% chance.
2PL adds a discrimination. It is the most common choice in the AI studies the main paper reviewed.
3PL adds a pseudo-guessing floor, as on a multiple-choice test.
1PL gives each question only a difficulty. 2PL adds a discrimination, written a. It says how sharply a question splits weak models from strong ones. 3PL adds a pseudo-guessing floor, written c. Main paper §2.1 Among the AI studies the main paper reviewed, 2PL was the most common. Main paper §3
A question with a discrimination near zero tells you little: strong and weak models get it right about equally often. A negative one is worse. Weaker models get it right more often than stronger ones. Leaderboards §5.2
The formulas, in words
σ is the S-shaped logistic curve. It turns any number into a chance between 0 and 1. Main paper §2.1
- 1PL: chance = σ(θ − b). Only the gap between strength and difficulty matters.
- 2PL: chance = σ(a(θ − b)). The gap is first multiplied by the discrimination a.
- 3PL: chance = c + (1 − c) σ(a(θ − b)). The chance never drops below c.
3. Fitting IRT needs data and a method
To fit IRT, you need the response matrix and an estimator. The estimator finds every θ and every question's settings at once. Main paper §2.1 The main paper compares four. Main paper §4.2
- MML-EM, the standard method in school testing. Main paper §4.2
- MCMC, careful but slow. Main paper §4.2
- VI, a fast approximation. Main paper §4.2
- PSN, a small neural network. Main paper §4.2
Most of them assume the models' strengths form a normal distribution. Main paper §2.1 PSN does not. Main paper §4.2
School testing also has rules of thumb for how many test-takers IRT needs. For 1PL and 2PL, the advice is 250 to 500. Main paper §2.2 For 3PL it is 1,000 to 3,000. Main paper §2.2
What each fitting method does
MML-EM fits the question settings while it averages over all possible strengths. It assumes those strengths follow a normal distribution. Its guarantees hold as the number of test-takers grows and the number of questions stays fixed. Main paper §4.2
MCMC draws many random sets of all the settings, in proportion to how well each set explains the data. Its run time grows with models, questions and run length. Main paper §4.2
VI replaces that sampling with a simpler shape that it tunes step by step. It keeps the normal distribution assumption and adds its own approximation error. Main paper §4.2
PSN learns the settings as the weights of a small network. It does not assume a normal distribution. It gives no error bars and no guarantee that the settings are right. Main paper §4.2
A question has a large difficulty and a discrimination near zero. What does a right answer to it tell you about a model?
Little. With a discrimination near zero, strong and weak models get it right about equally often, so the answer barely moves the estimate of θ.
Why does an estimator need many test-takers to pin down one question's settings?
Each question's settings are fitted only from that question's column: one answer per test-taker. Few test-takers means few answers per question. Main paper E.3
chapter 3
Paper 1: IRT on a leaderboard
The idea
The Leaderboards paper, by Rodriguez and five co-authors, proposes the DAD leaderboard. It fits IRT to the answers of every model on every question. Leaderboards §1.1 It uses the SQuAD 2.0 leaderboard: 161 models on the development set and 11,873 questions. Leaderboards §4.2.1 It fits IRT with VI. Leaderboards §2.2
The paper also adds feasibility, a ceiling on a question's chance of a right answer. A low ceiling suggests the question or its answer is broken. Leaderboards §2
Rankings from few questions
Figure 4 from the Leaderboards paper: rankings from small samples of questions Leaderboards Figure 4 open full size
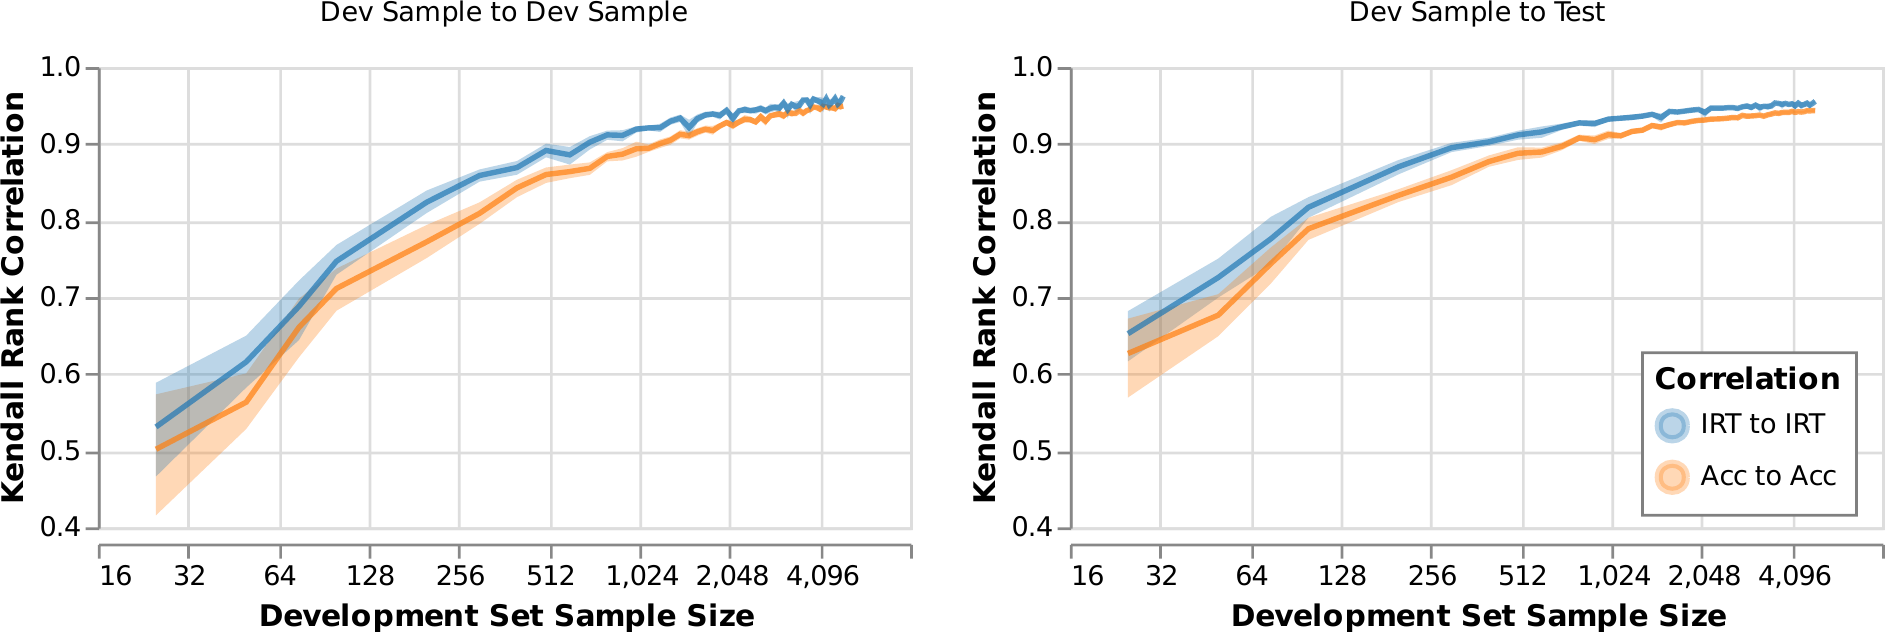
Left: models ranked on one small sample of questions, then on another. With few questions, the IRT order (blue) agrees with itself more often than the accuracy order (orange).
Right: compare with the ranking on the hidden test set. Again blue is above orange.
With thousands of questions the two lines meet. The gain is largest when the sample is small.
The test ranks the models on a small sample of questions. It ranks them again on a second sample and compares the two orders. Leaderboards §4.3.1 When the samples are small, the IRT order is more stable than the order by accuracy. Leaderboards §4.3.1
"Sample size" here means the number of questions. In the main paper it means the number of models. The two papers vary different sides of the response matrix.
Finding broken questions
The authors read 60 questions picked by their IRT numbers. Leaderboards §5.2 Those with a negative discrimination were often flawed. Leaderboards §5.2 The most negative one asked why demand for rentals decreased. Its stored answer was that demand for higher quality housing increased. Leaderboards Figure 1 Their own agreement on what counted as flawed was modest. Leaderboards §5.2
Choosing questions to label
Labelling answers costs money. The paper picks the next question to label with computerized adaptive testing. Leaderboards §4.4 It ranks questions by Fisher information: how much an answer would narrow down a model's θ. That is largest when a right and a wrong answer are equally likely. Leaderboards §4.4 With few labelled questions, this beat random picks. Picking the hardest questions did worse than random. Leaderboards §4.4
The limit the paper names
IRT needs every model's answer to every question. The paper notes that this is often available only to the leaderboard's organizers. Leaderboards §7.1 OpenEval, at the end of this page, is about that limit.
The Leaderboards paper finds IRT rankings more stable with small samples. Small samples of what?
Of questions. The paper keeps all models and draws small sets of questions. The main paper does the opposite: it varies the number of models.
Why would a negative discrimination point to a broken question?
It means weaker models get the question right more often than stronger ones. For a sound question the reverse should hold, so a wrong answer key or an unanswerable question is a likely cause. Leaderboards §5.2
chapter 4
Paper 2: 100 questions in place of 14,000
The problem
Running every model on every benchmark is costly. One run of a large benchmark suite can take over 4,000 GPU hours. tinyBenchmarks §1 TinyBenchmarks asks how few questions are enough to estimate a model's full score. tinyBenchmarks §2 It assumes earlier models have already answered every question. tinyBenchmarks §2
The method
How tinyBenchmarks estimates a full score from 100 questions tinyBenchmarks §5
Many models already answered every question. IRT is fitted to their answers once.
Questions with similar IRT settings are grouped. One question stands in for each group, weighted by the group's size.
A new model answers only these stand-in questions: 100 per scenario.
IRT finds the new model's capability from those answers and predicts the rest.
The final estimate mixes the plain score and the prediction. Together this is IRT picks plus blending.
A benchmark here is split into scenarios, such as MMLU inside the Open LLM Leaderboard. tinyBenchmarks §2 The method picks anchor points: questions that each stand for a group of similar questions. tinyBenchmarks §3.2 Similar means close in multidimensional IRT settings, fitted with VI. tinyBenchmarks §4.1 tinyBenchmarks §4.4
A new model answers only the anchor points. The p-IRT predicts its answers on the rest. tinyBenchmarks §4.2 The gp-IRT mixes that prediction with the plain score on the anchor points. tinyBenchmarks §4.2 Both steps together are IRT++. tinyBenchmarks §5
What it found
Figure 1 from tinyBenchmarks: estimated against true MMLU accuracy, from 100 questions tinyBenchmarks §1 open full size
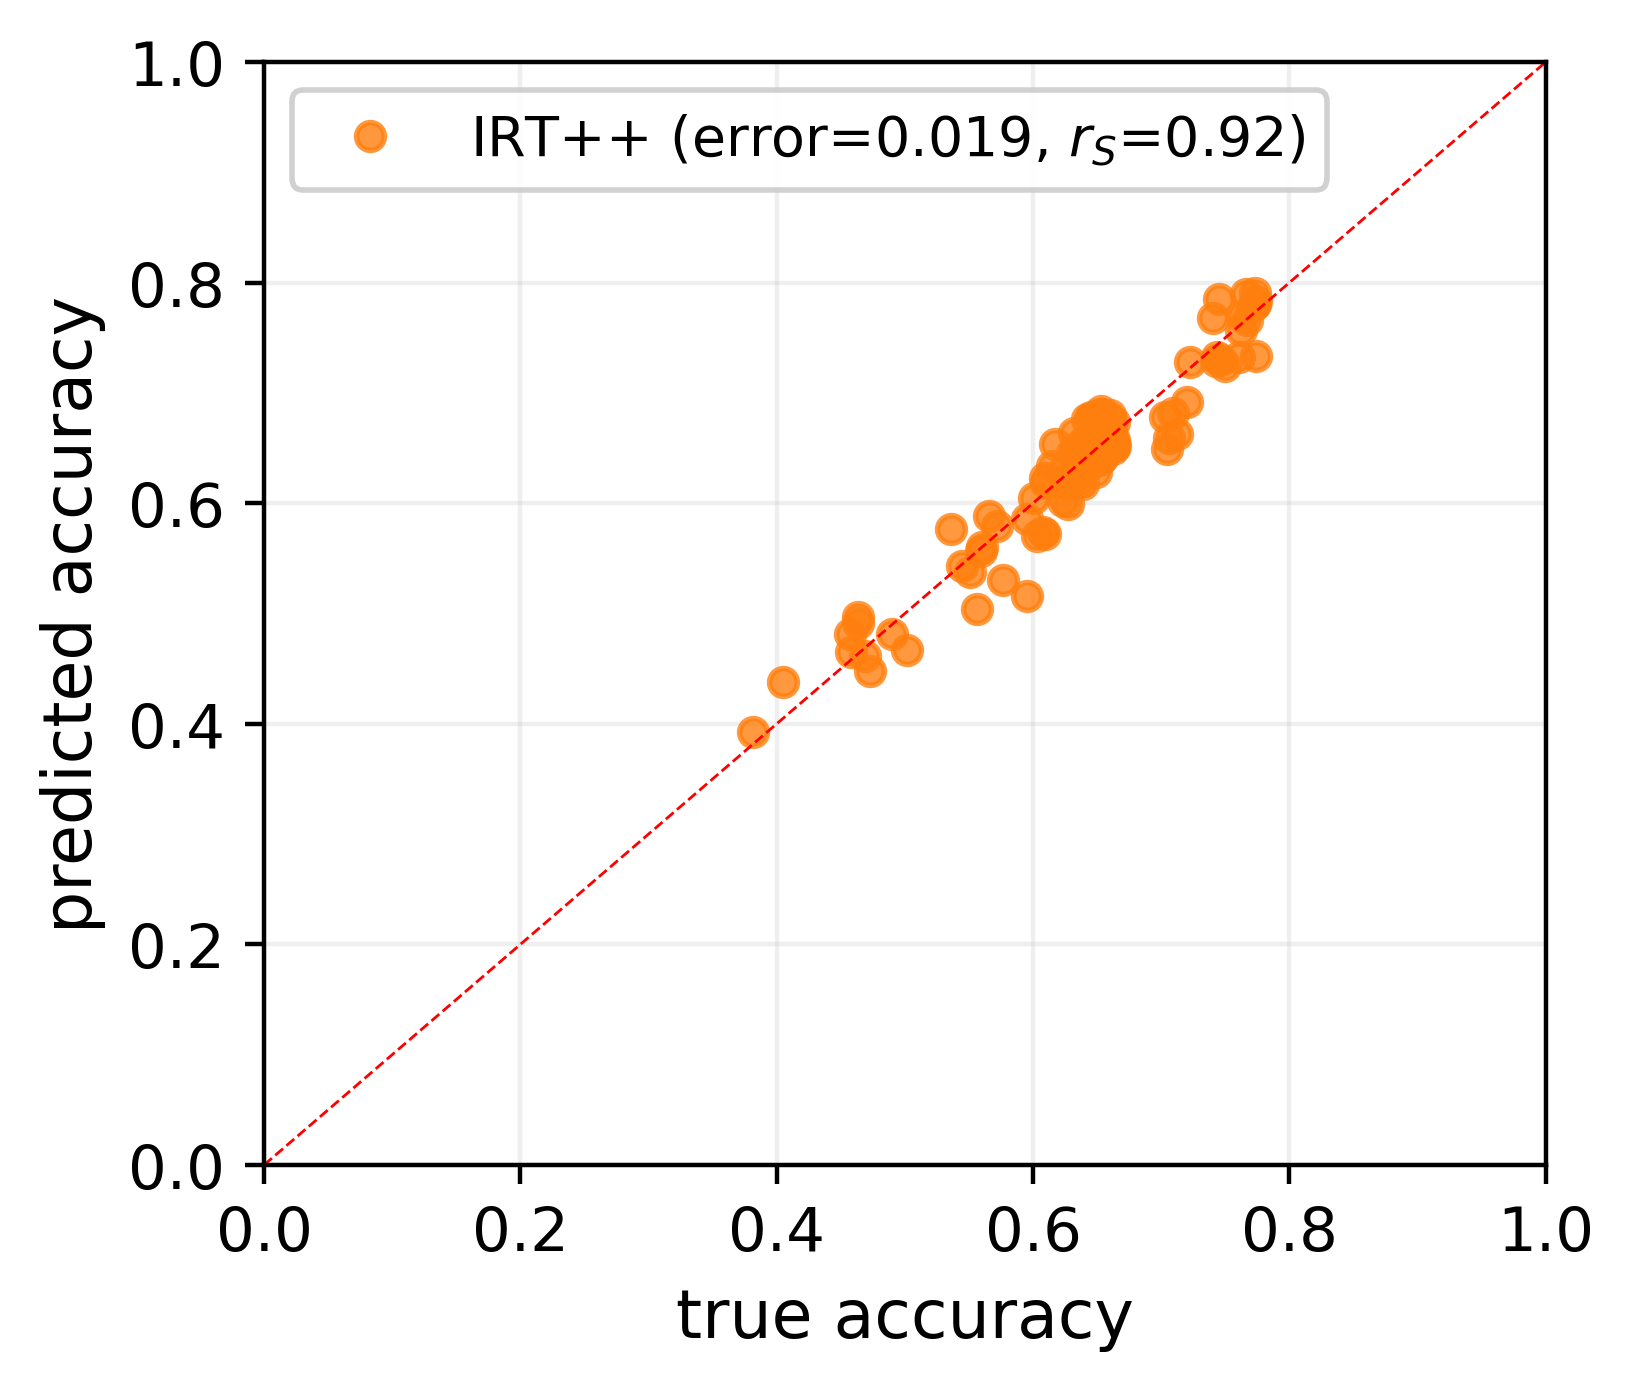
IRT++ on recent models: the average miss is 0.019 in accuracy.
Each dot is a model. Dots on the red dashed line would be exact. They sit close to it.
With 100 questions per scenario, the best methods estimated full scores within about 2%. For MMLU, that is 100 of about 14,000 questions. tinyBenchmarks §5 The IRT-based methods did well across benchmarks and splits, and IRT++ never did worse than plain IRT picks. tinyBenchmarks §5
Note what is estimated: each model's average score. tinyBenchmarks §2 The question settings are only a tool for that. This difference matters in the main paper's results.
How many models it learned from
For the Open LLM Leaderboard and MMLU, the method learned from 395 models. Three quarters were used for fitting and one quarter for testing. tinyBenchmarks §5 Another benchmark it tested had only 30 models. tinyBenchmarks §5 The main paper lists tinyBenchmarks among studies with about 30, 100 and 400 models. Main paper §4.1
The test models were either a random quarter or the most recent quarter. The recent split is harder, because newer models are stronger. Most methods still did well on it. tinyBenchmarks §5 On 40 hand-picked specialist models, the IRT picks were only slightly affected. tinyBenchmarks §5
TinyBenchmarks asks a new model only 100 questions. Where does the rest of its estimated score come from?
From IRT. The 100 answers give the model's θ. IRT then predicts its chance on every skipped question, and these are blended with the plain score. tinyBenchmarks §4.2
What does tinyBenchmarks need before it can test a new model?
Answers from many earlier models on every question, to fit IRT and choose the anchor points. tinyBenchmarks §2
chapter 5
The main paper: plant the answer, then look for it
The AI-versus-school data gap
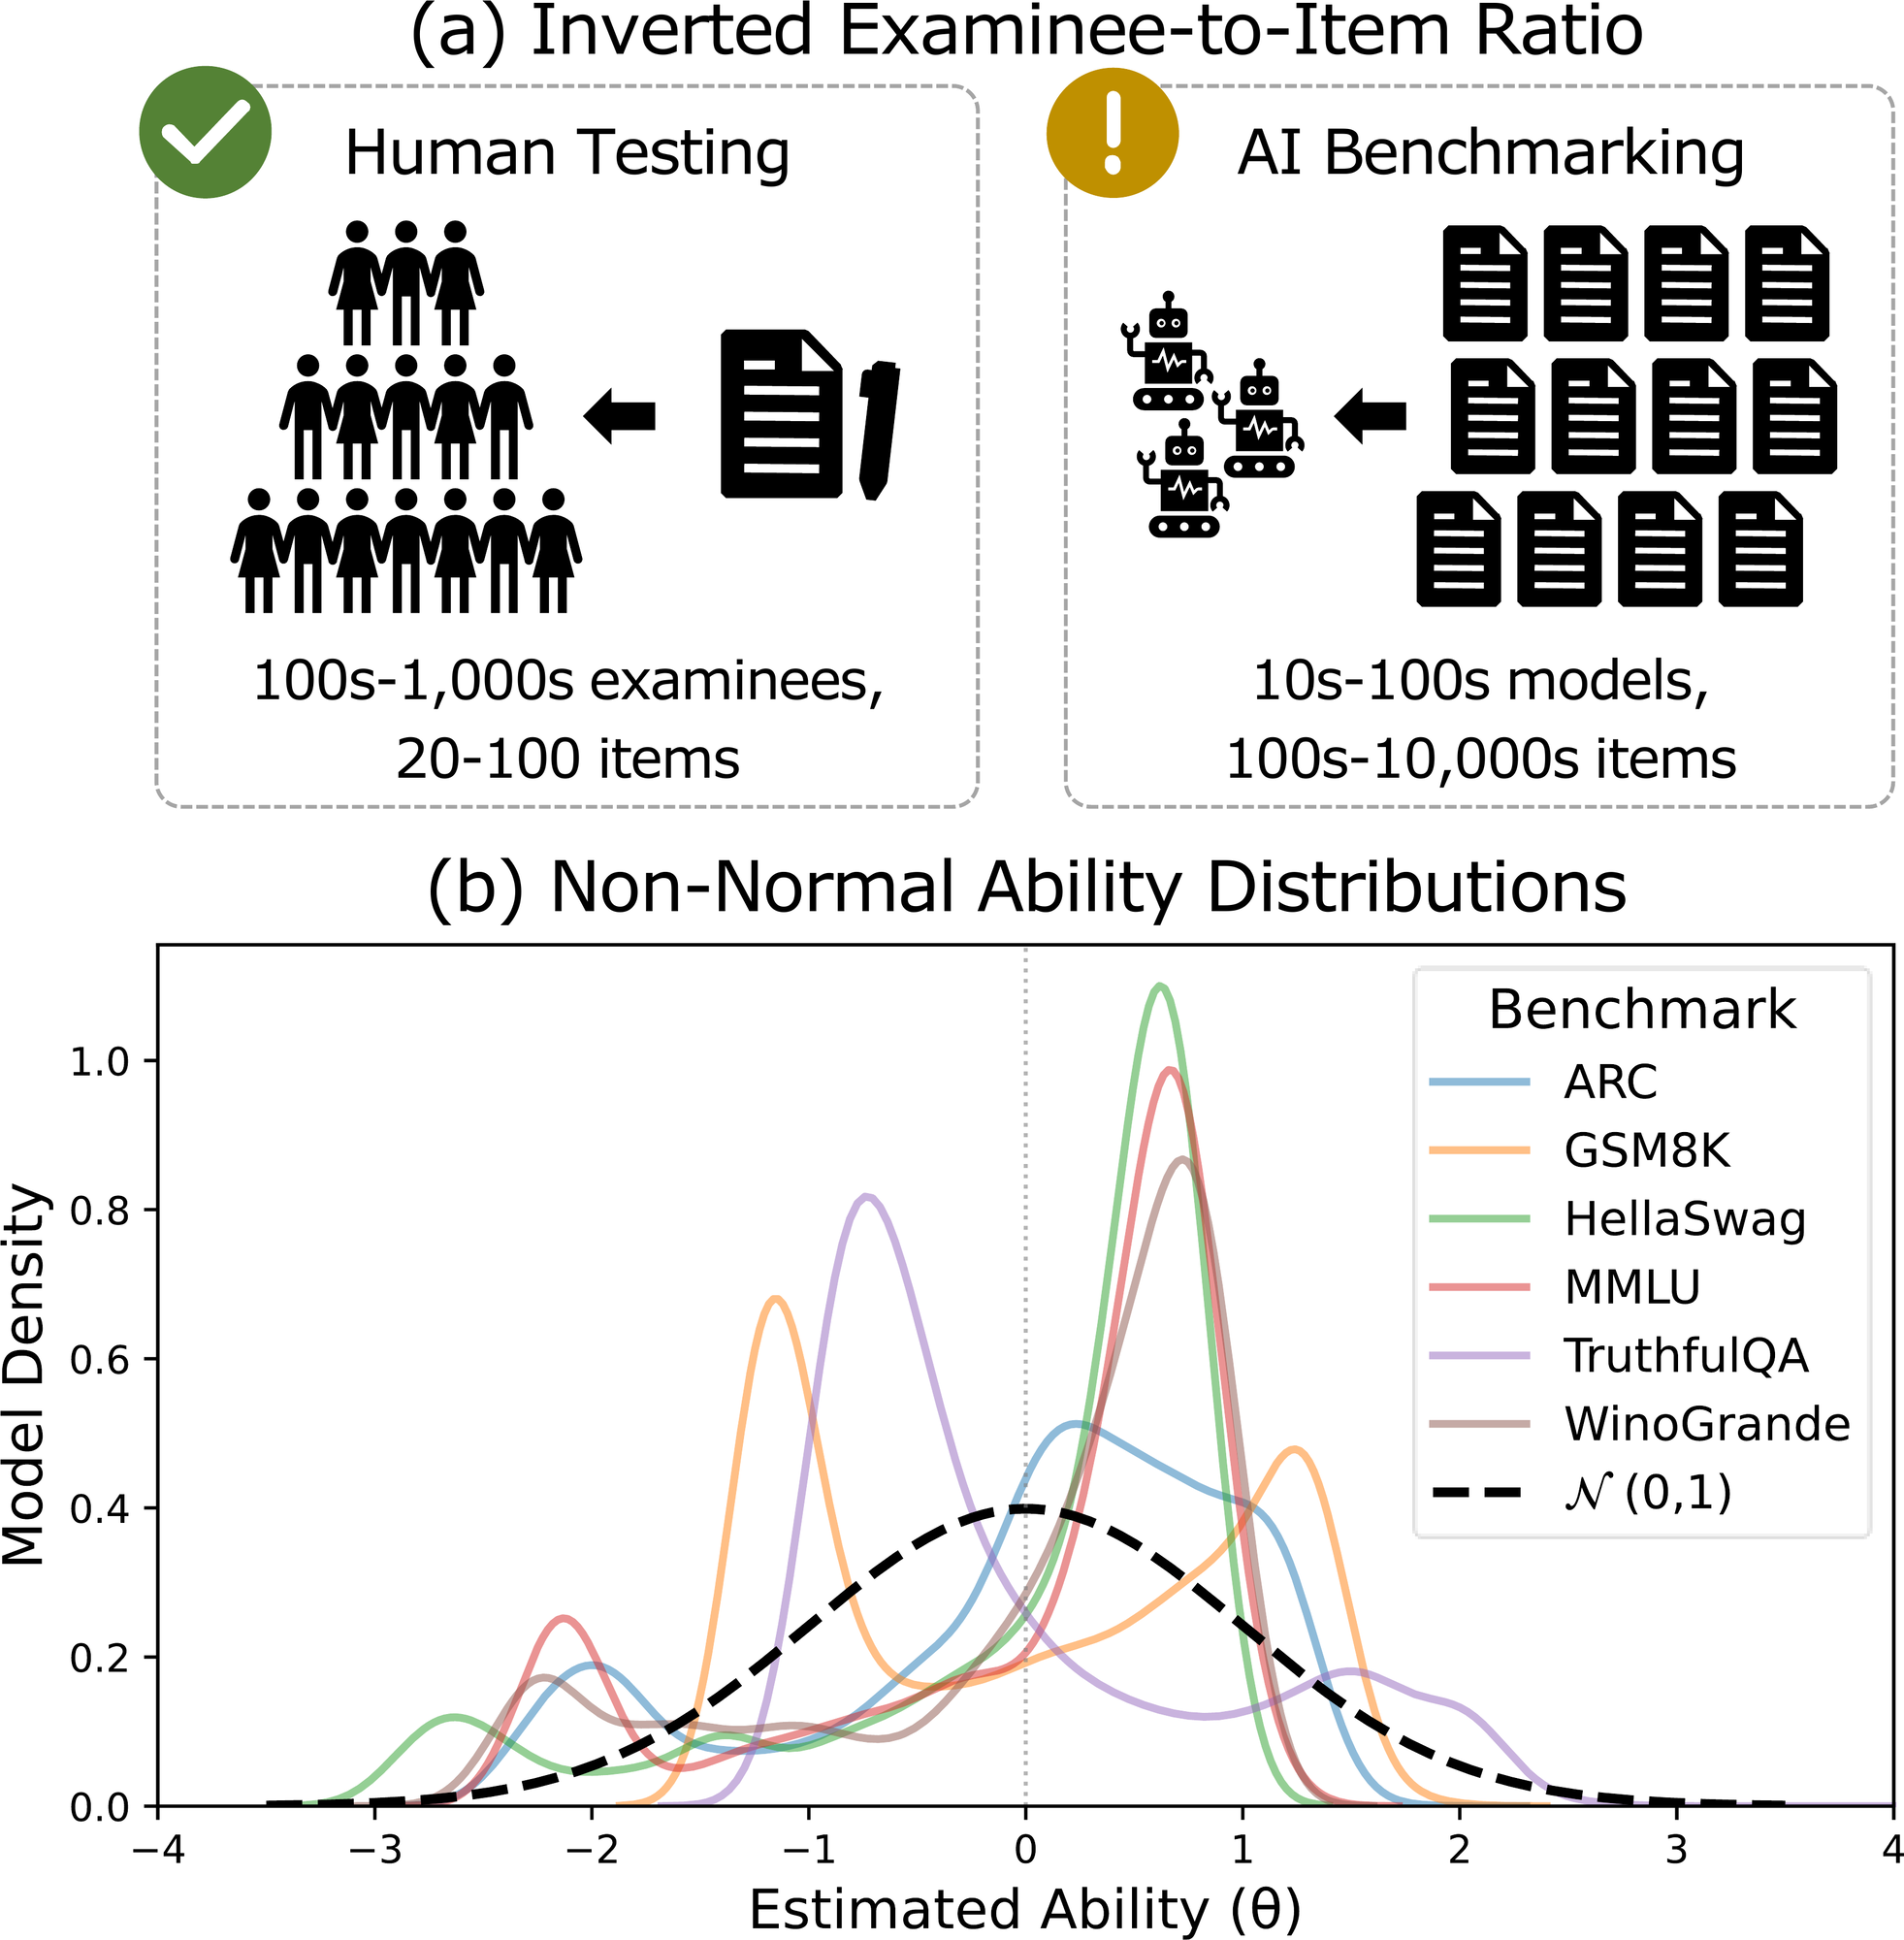
IRT was built for school tests: hundreds to thousands of students and 20 to 100 questions. AI benchmarks often have fewer than 100 models and up to tens of thousands of questions. Main paper §1 The paper calls this the data regime mismatch. Main paper Figure 1
There is a second difference. The spread of model strengths is often lopsided or has more than one peak, so it is not a normal distribution. Main paper §1 Why? Leaderboard models are not a random sample. Many are built on the same base models, by community members. Main paper §2.1
What AI studies do now
The authors searched arXiv up to April 2026 and found 19 studies that fit IRT to AI benchmarks. Main paper §3 Many used tens to low hundreds of models, and some fewer than 50. Benchmarks had from a few hundred to over 80,000 questions. Main paper §3 The fitting methods varied: MML-EM, MCMC, VI and neural networks. Main paper §3
The simulation study
The main tool is a simulation study. You choose the true settings, make fake answers from them, fit IRT, and check how close the fit gets. Main paper §2.2
The main paper's simulation study: plant the answer, then try to find it Main paper §4.1
Start from real answers: six benchmarks, each with over 5,000 models. Fit IRT to them.
Treat the fitted question settings as the truth. The real, lopsided spread of model capabilities is kept too.
Draw N models from that spread and make up their right and wrong answers from the planted settings.
Fit IRT again with MML-EM, MCMC, VI and PSN, as a study with only N models would.
Because the truth is known, every fitted number can be scored. Each setting is repeated 50 times.
The settings come from six benchmarks of the Open LLM Leaderboard, each with over 5,000 models. Main paper §4.1 They range from 644 to 12,508 questions. Main paper §4.1 The fitted question settings become the true item parameters. Main paper §4.1 The models drawn in each run keep the real, lopsided spread of strengths. Main paper §4.1
Three IRT models, five numbers of models and six benchmarks make 90 settings. Each ran 50 times with fresh data, the replications. Main paper §4.1 With four fitting methods, that is 18,000 runs. Main paper Abstract
What was scored
- Model order. Ranking recovery uses Kendall's τ: 1 means the fitted order equals the true one. Main paper §4.3
- Average scores. Aggregate score error is the gap between each model's true and fitted expected score. Main paper §4.3
- Question settings. Difficulty recovery and discrimination recovery are correlations between true and fitted settings. Main paper §4.3
- Short tests. The questions with the most Fisher information form a short benchmark. The question is whether it ranks 4,000 unseen models as the full benchmark does. Main paper §4.3
The true item parameters come from a VI fit, and VI is one of the methods being scored. The authors checked this with settings fitted by PSN. The methods compared about the same, except on difficulty recovery. Main paper B.2
In a simulation study, why can the fitted numbers be scored at all?
Because the true settings were chosen before the fake answers were made. In real data no one knows the true settings. Main paper §2.2
The paper keeps the lopsided spread of real leaderboard models. What would be lost if it drew strengths from a normal distribution?
It would test only the case IRT was built for. One of the two ways AI data differs from school data, the non-bell-shaped spread, would be missing. Main paper §1
chapter 6
What they found
Two fitting methods could not finish on large benchmarks
MML-EM failed in 69.45% of runs: it ran out of memory or did not converge. Main paper §5.1 On HellaSwag and MMLU it ran out of memory. Main paper §5.1 MCMC often took over 10,000 seconds per run. Some large settings did not finish in 72 hours. Main paper §5.1 VI failed in 10.71% of runs, mostly with 3PL. PSN never failed. Main paper §5.1
The run times were measured on different machines. PSN ran on a GPU and the others on CPUs, so this is a test of what is practical. It is not a fair speed race. Main paper §5.1
Model rankings: more models did not help
The paper raised the number of models from 30 to 1,000. How much do you think ranking recovery improved?
The part below opens after your guess.
The number of models had a small effect, and its sign was slightly negative. Main paper D
Ranking recovery fell below 0.60 in some settings. It depended mostly on the benchmark and the IRT model. The number of models and the fitting method mattered little. Main paper §5.2
Figure 3 from the main paper: what predicts poor ranking recovery Main paper Figure 3 open full size
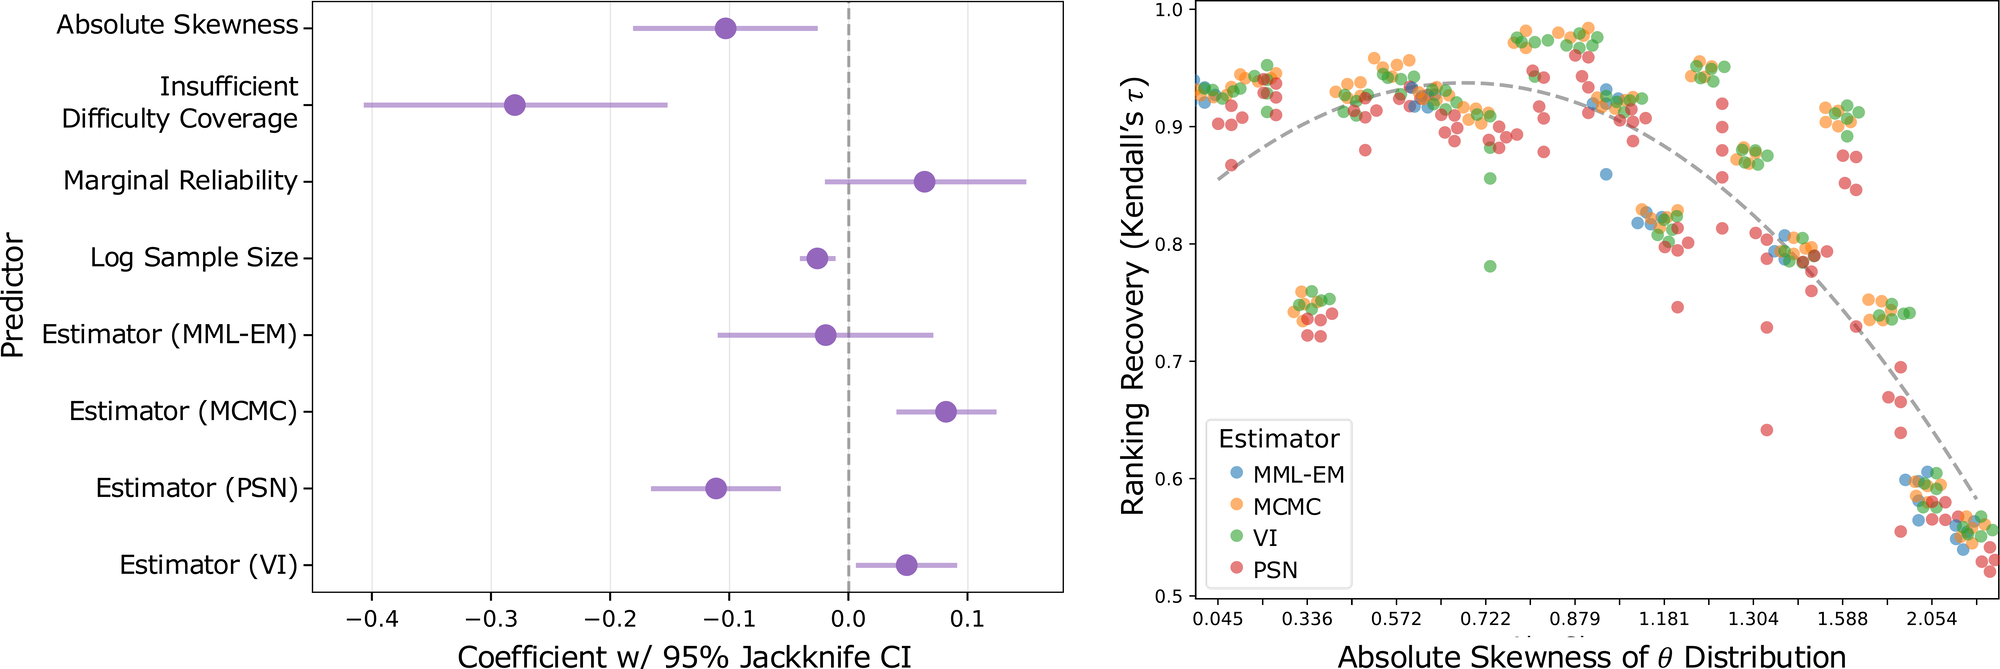
The strongest predictor of a poor ranking is too few matching questions: most models have few questions pitched near their own level.
The number of models barely matters, and slightly in the wrong direction.
Right: the more lopsided the spread of capabilities, the worse the ranking. At the far right, Kendall's τ is near 0.55.
What did predict it? The paper fitted a regression on four candidate causes and the fitting method. Main paper §5.2 The strongest was insufficient difficulty coverage: the share of models with five or fewer questions near their own level. Main paper §5.2 Start from a regression with only the number of models and the fitting method. Adding insufficient difficulty coverage raised the share of differences it explains from .039 to .760. Main paper §5.2
Skewness of the models' strengths also predicted poor rankings. Main paper §5.2 The two are linked. Their Kendall's τ with each other was .40, and lopsidedness still added to the prediction. Main paper §5.2
Average scores were still close
Here the score is each model's expected score on the full benchmark, worked out from the fitted settings. These stayed accurate. Aggregate score error stayed below .025 in most settings, even where rankings were poor. Main paper §5.2 This agrees with tinyBenchmarks. Main paper §5.2
How can both be true? Models with nearly equal strength can swap places when a small error moves one of them. Their scores barely change. Main paper §5.2 The authors still warn that order matters when a ranking is used to choose a model. Main paper §5.2
Question settings: 30 models is too few
With 30 models, how well do you think the fitted difficulty matched the true one?
The part below opens after your guess.
Figure 4 from the main paper: recovering question settings under 2PL Main paper Figure 4 open full size
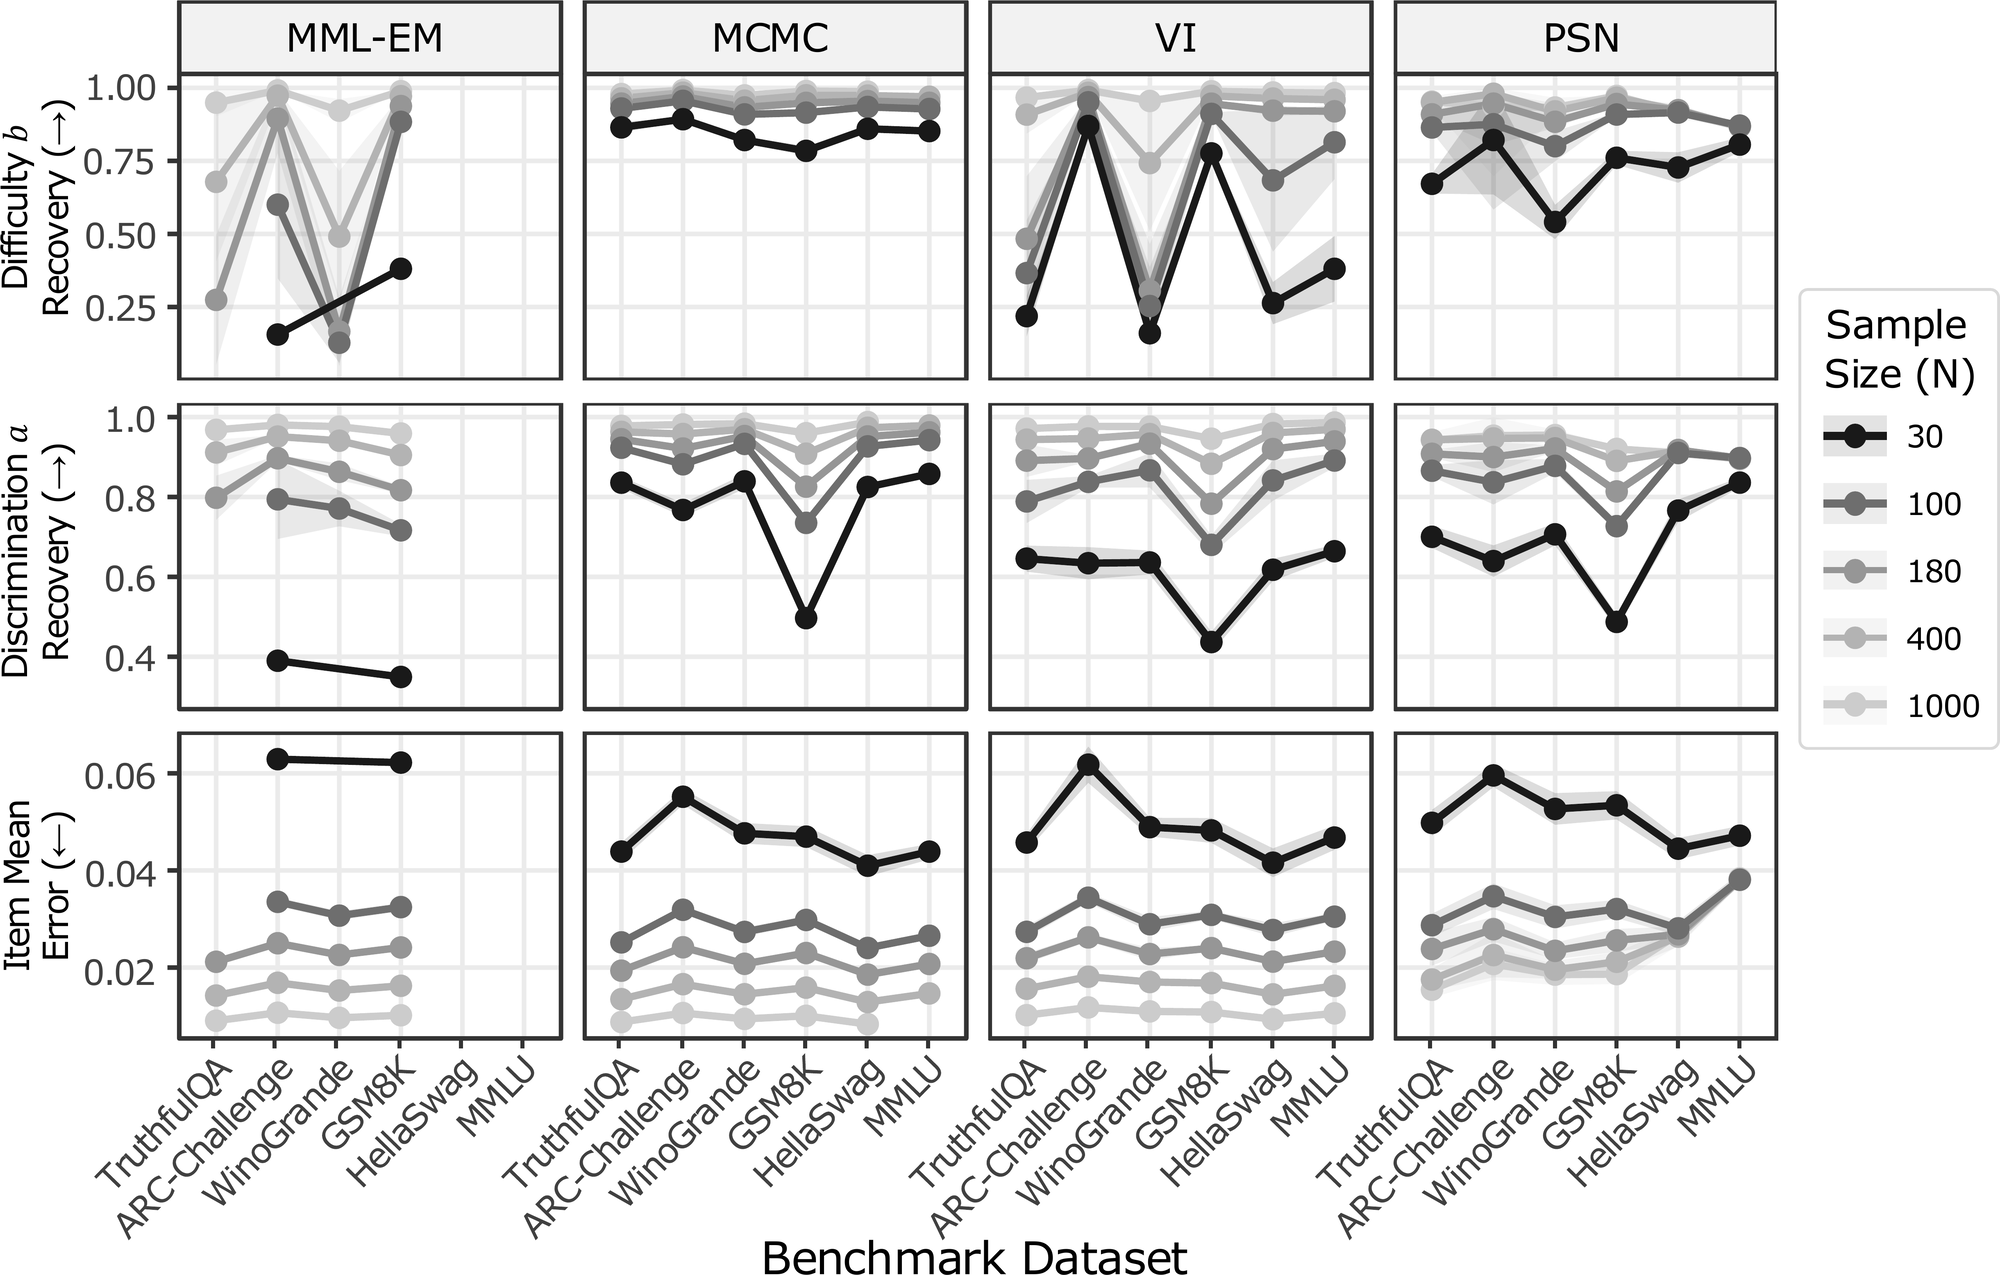
Bottom row: the error in each question's average. The darkest line is 30 models. It sits far above the rest for every fitting method.
Middle row, discrimination recovery: again the 30-model line is lowest.
Top row, VI: difficulty recovery drops below 0.5 on some benchmarks, even with more than 30 models.
MML-EM has no points for HellaSwag and MMLU: it ran out of memory.
With 30 models, no fitting method recovered the question settings well. Main paper §5.3 Difficulty recovery fell below 0.50 in some cases, and discrimination recovery below 0.60. Main paper §5.3 With 100 models it improved markedly. Main paper §5.3
Was the lopsided spread to blame? Two extra tests used strengths close to a normal distribution, or drawn from one. The gap between 30 and 100 models stayed. Main paper §5.3
Why many questions do not make up for few models
Each model's θ is fitted from all its answers, so many questions help pin down θ. Each question's settings are fitted from that question's column alone, which has one answer per model. Main paper E.3 A long benchmark does not add answers to any one column. Main paper E.3
By fitting method. MCMC recovered the settings best when it finished. Main paper §5.3 VI is among the most used methods in AI studies. Its difficulty recovery was below .50 for 180 or fewer models on TruthfulQA and GSM8K. Main paper §5.3 MML-EM was unreliable with few models even when it converged. PSN landed between. Main paper §5.3
Short tests: barely better than random
Under 2PL, how did short benchmarks picked by Fisher information rank models, compared with random picks of the same size?
The part below opens after your guess.
Figure 5 from the main paper: short benchmarks picked by Fisher information against random picks Main paper Figure 5 open full size
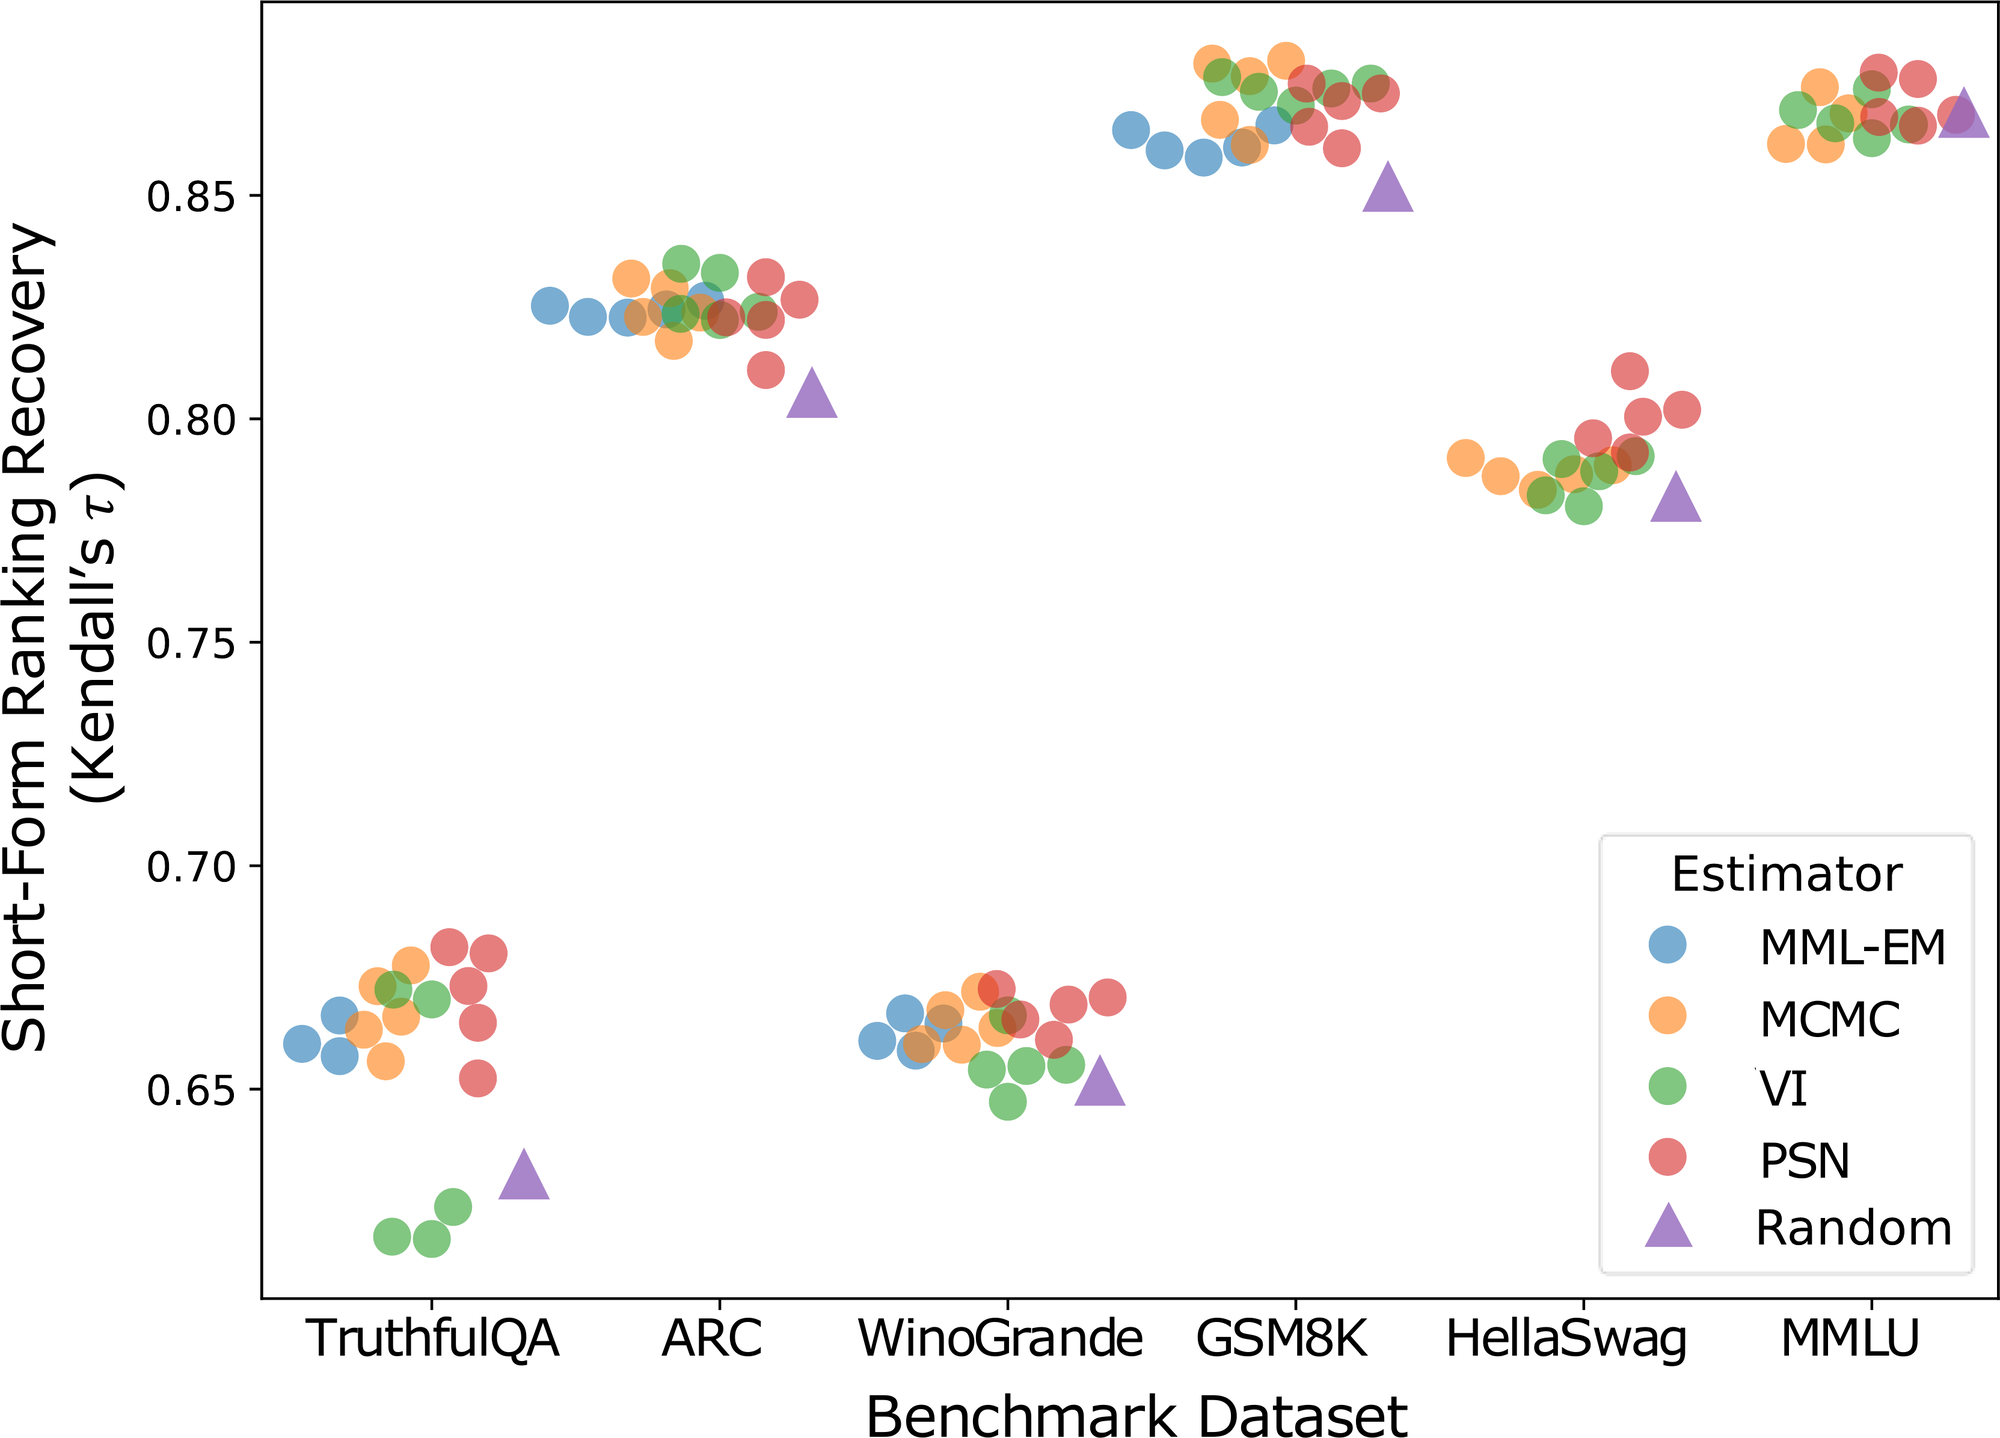
Purple triangles are random picks of the same size. On MMLU, the IRT picks do about as well as random, no better.
On GSM8K the IRT picks are a little higher than random.
On TruthfulQA, the picks made with VI rank models worse than random picks.
The IRT-picked short benchmarks showed large gains over random picks only under 1PL. Under 2PL and 3PL the gain was marginal. Main paper §5.4 Larger picks, up to 2,500 questions for MMLU, still did about as well as random. Main paper §5.4
What the authors recommend
- Pick the fitting method by the job. MCMC recovered settings best when it could run. VI was fast and ranked models slightly better, but its settings were sometimes off. Main paper §6
- Claims about single questions need more than 30 models. Recovery improved at 100 or more. Main paper §6
- Check your own data. Treat your fitted settings as the truth, simulate answers with the same number of models, refit and compare. Main paper §7
That check is a best case. It assumes the IRT model itself is correct. Main paper §7 The authors released their code for it. Main paper §7
Average scores stayed accurate while rankings were poor. How can both be true?
Many models have nearly the same strength. A small error can swap two of them without moving either score much. Main paper §5.2
Why does a benchmark with 12,000 questions not fix item settings fitted from 30 models?
Each question's settings depend only on that question's answers, one per model. More questions add more columns. Each column still has one answer per model. Main paper E.3
What did best predict poor ranking recovery?
Too few questions near the models' own level (insufficient difficulty coverage), followed by lopsided strengths. The number of models and the fitting method mattered little. Main paper §5.2
chapter 7
Paper 3: release every answer
The position
Every benchmark run already produces each question, how it was posed, each model's answer and its score. Most of it is thrown away once the averages are computed. OpenEval §3 The OpenEval paper argues that this item-level data should be released with the averages whenever legally and ethically possible. OpenEval §1
Why? Many problems are invisible in an average. Examples are questions that do not separate models, data contamination, and benchmark saturation. OpenEval §1 OpenEval §2.2 The paper also names the problem the main paper measures: IRT methods face few models and broken assumptions. Shared data lets researchers study this. OpenEval §3
The repository
The authors built the OpenEval repository with one schema for every record. OpenEval §4 A record keeps the original question apart from the exact input the model saw, and stores the model's settings. OpenEval §4 It holds over 10.7 million answers to over 160,000 questions. OpenEval Abstract They come from 444 models. Each dataset has between 11 and 252 models. OpenEval §4
Two analyses that need per-question data
The first uses CTT. It describes questions straight from the table, with fewer assumptions than IRT. OpenEval §5.1 On MMLU-Pro, many questions already had very low difficulty for 72 recent models, a sign of benchmark saturation. Fewer of its questions had low discrimination than MMLU's. Some still did, despite expert review. OpenEval §5.2
The second uses IFA: which questions models get right or wrong together. OpenEval §5.1
Figure 5 from the OpenEval paper: bAbI Task 15 questions grouped by how models answered them OpenEval Figure 5 open full size
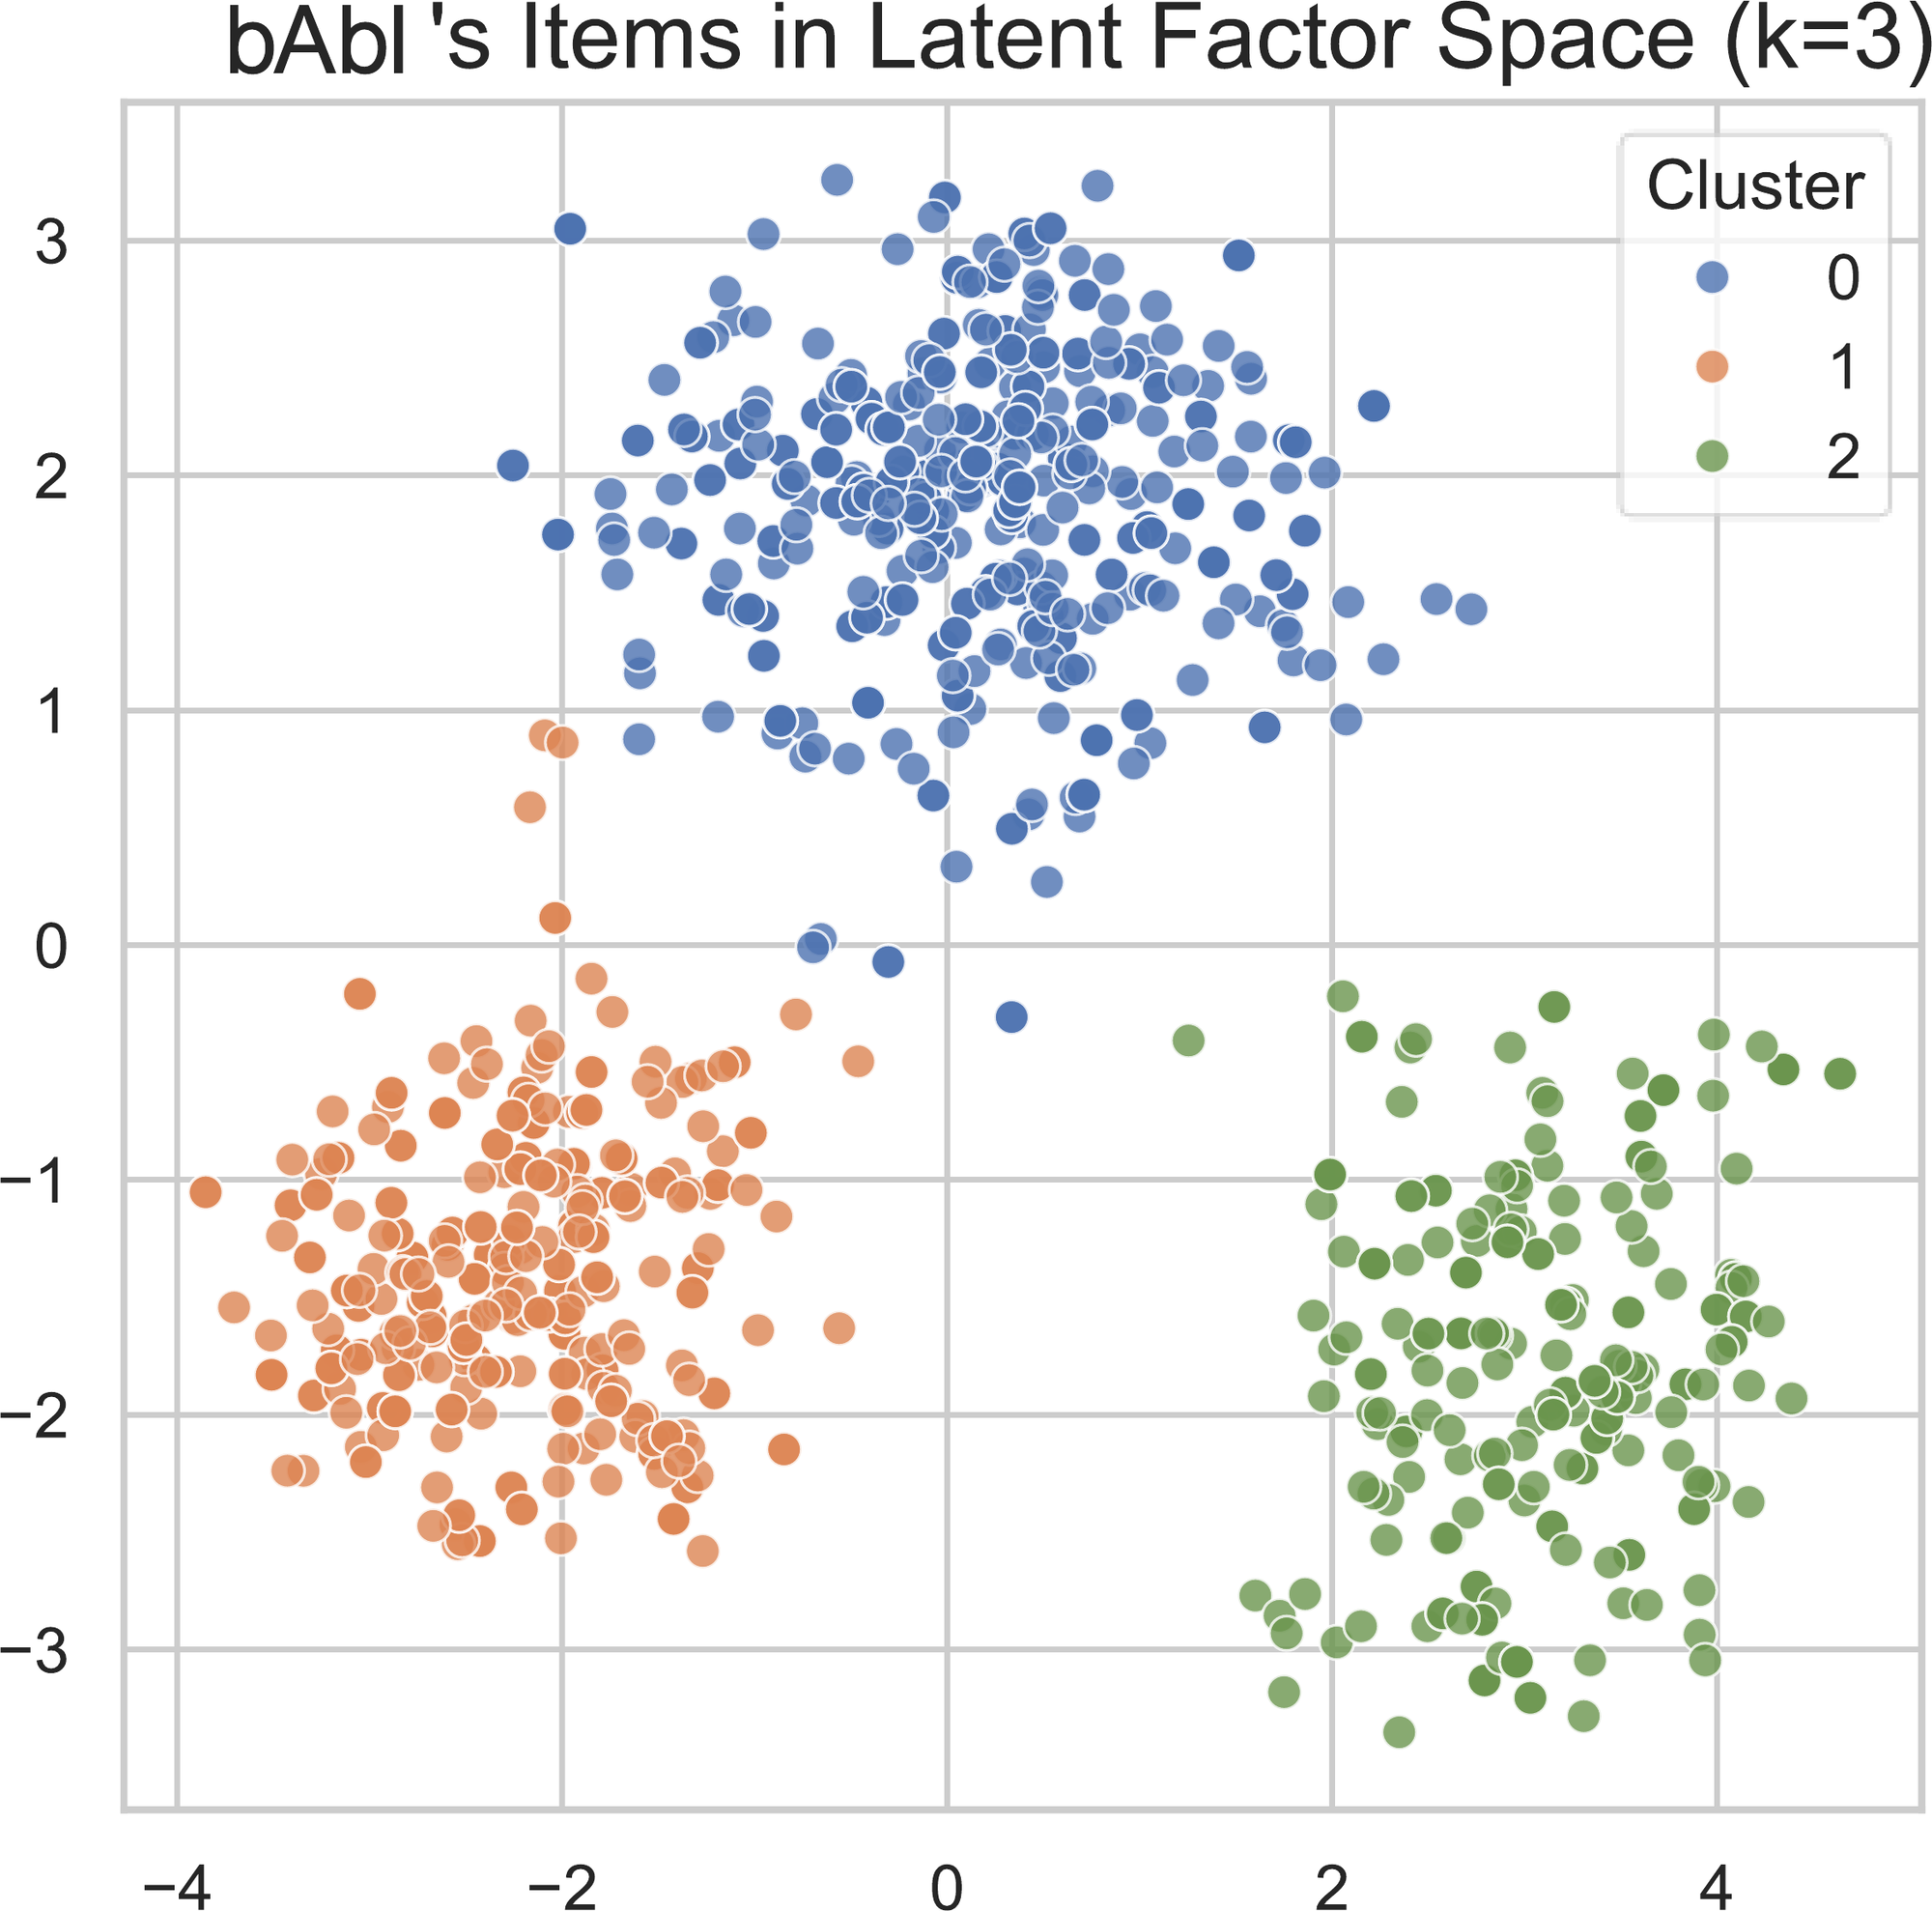
Each dot is a question, placed by which models got it right. Cluster 0: almost all questions whose answer is “mouse” or “cat”.
Cluster 1: questions whose answer is “wolf”.
Cluster 2: questions whose answer is “sheep”. The groups follow the answer word, not the reasoning step.
BAbI Task 15 is meant to test simple deduction. OpenEval §5.3 Its questions grouped by the answer word, such as “wolf” or “sheep”, not by the reasoning. Models may partly be scored on which animal they tend to name. OpenEval §5.3 The paper calls this a sign of construct misalignment: a test that may measure something other than its target. OpenEval §5.3
Two objections the paper answers
Releasing questions spreads them into training data. The paper argues that known, released questions are easier to filter out and to audit. It also allows held-out sets, gated access and release after a waiting period. OpenEval §7
It is extra work. The answers already exist after a run, so no model has to be run again. The work is converting, checking and uploading. OpenEval §7
Why does the OpenEval paper call item-level data a requirement for checking IRT?
IRT is fitted from every model's answer to every question. Without those answers, no one outside the team can refit it or test its numbers. The main paper's check needs a fitted model on real data. OpenEval §3 Leaderboards §7.1
What made the bAbI Task 15 result a warning sign?
The groups of questions lined up with the answer word instead of the deduction step the test claims to measure. OpenEval §5.3
chapter 8
What this does not show
These limits come from the papers, except in the boxes marked otherwise.
- The main paper tested a few settings. It did not test between 30 and 100 models, where most of the gain happened. It tested only one-trait 1PL, 2PL and 3PL, and four fitting methods. Main paper §7
- Two causes overlap. Skewness and insufficient difficulty coverage moved together in the leaderboard data, so the paper could not separate their effects on rankings. Main paper §7
- Six benchmarks from one leaderboard. The advice holds for settings like these. Main paper §7
- The check is a best case. A simulation study from your own fitted settings assumes the IRT model is right. Main paper §7
- The Leaderboards paper uses one dataset, SQuAD 2.0, and calls itself a proof of concept. Leaderboards §7.1
- TinyBenchmarks expects drift. Newer models may answer in new patterns, so its authors advise updating the questions and the IRT fit from time to time. tinyBenchmarks §6.2
- The OpenEval factor labels are descriptive. The labels came from GPT-5 and were then revised by hand. OpenEval §5.3
The main paper's short benchmarks take the questions with the most Fisher information and score model order. TinyBenchmarks picks anchor points by grouping questions, then estimates scores with gp-IRT. So the main paper's short-test result is not a direct test of tinyBenchmarks. Its average-score result agrees with tinyBenchmarks Main paper §5.2. This is not from the papers.
TinyBenchmarks fits multidimensional IRT, with several strengths per model. tinyBenchmarks §4.1 The main paper tests only one-strength models. Main paper §7 Whether its 30-model warning holds for multidimensional IRT is open. This is not from the papers.
Each OpenEval dataset has 11 to 252 models. OpenEval §4 By the main paper's results, claims about single questions would be weak for datasets near the low end. Adding more benchmarks does not help; adding models to the same questions does. This is not from the papers.
keep it
This page has 15 check-yourself questions. The review page asks them again after 1, 3, 7 and 21 days, one at a time. You can also download them for Anki.
chapter 9
Words to know
Every term on this page, in the order it appears. Each entry names the paper its definition comes from.
- IRT (the test-scoring model)
- A model from school testing. It gives each test-taker one hidden score and each question its own settings, and from these predicts the chance of a right answer."Specifically, IRT models the probability of the correct response to an item as a function of a latent ability parameter θ and one or more item-level parameters capturing item characteristics" (Main paper §2.1)
- response matrix (table of right and wrong answers)
- A table with one row per model and one column per question. Each cell is 1 if the model got that question right and 0 if not."Given a response matrix Y ∈ {0,1}^{N×J} where each entry y_{i,j} records whether examinee i answered item j correctly, an IRT model is fit to jointly estimate θ_i for each examinee and the item parameter(s)" (Main paper §2.1)
- capability (hidden strength)
- The one number IRT gives each model. It is never seen directly; it is worked out from which questions the model got right. The symbol is θ (theta)."Specifically, IRT models the probability of the correct response to an item as a function of a latent ability parameter θ and one or more item-level parameters capturing item characteristics" (Main paper §2.1)also called in the paper: ability, skill
- difficulty (how hard a question is)
- The question's setting b. A model whose hidden strength equals b has a 50% chance of getting it right in the simplest IRT model."Its simplest form, the one-parameter logistic model (1PL, also known as the Rasch model), characterizes each item solely by its difficulty b" (Main paper §2.1)
- 1PL
- The simplest IRT model. Each question has only a difficulty."Its simplest form, the one-parameter logistic model (1PL, also known as the Rasch model), characterizes each item solely by its difficulty b" (Main paper §2.1)
- 2PL
- IRT with two settings per question: difficulty and discrimination. The most common choice in the 19 AI studies the main paper reviewed."The two-parameter logistic model (2PL) introduces a discrimination parameter a, allowing items to differ in how effectively they distinguish between high- and low-ability examinees" (Main paper §2.1)
- discrimination (how well a question separates models)
- The question's setting a. A high value means strong models get it right and weak models get it wrong. A value near zero means the answer tells you little about strength."The two-parameter logistic model (2PL) introduces a discrimination parameter a, allowing items to differ in how effectively they distinguish between high- and low-ability examinees" (Main paper §2.1)also called in the paper: discriminability
- 3PL
- IRT with three settings per question: difficulty, discrimination and a guessing floor."The three-parameter logistic model (3PL) further adds a pseudo-guessing parameter c, representing the probability that an extremely low-ability examinee responds correctly" (Main paper §2.1)
- pseudo-guessing (the guessing floor)
- The question's setting c: the chance that even the weakest model gets it right, for example by guessing on a multiple-choice question."The three-parameter logistic model (3PL) further adds a pseudo-guessing parameter c, representing the probability that an extremely low-ability examinee responds correctly" (Main paper §2.1)
- estimator (fitting method)
- The computer method that finds the hidden strengths and question settings from a table of right and wrong answers."We evaluated four IRT estimators spanning the major paradigms used in recent IRT-based AI evaluation studies (Sec. 3): MML-EM, MCMC, VI, and PSN." (Main paper §4.2)
- MML-EM
- The standard fitting method in school testing. It assumes the test-takers' strengths follow a bell curve."MML-EM estimates item parameters by maximizing the marginal likelihood, integrating out latent abilities under an assumed population distribution, typically the normal distribution." (Main paper §4.2)
- MCMC
- A fitting method that draws many random guesses of all the settings, keeping guesses in proportion to how well they explain the data. Careful but slow."MCMC performs full Bayesian inference, sampling from the joint posterior over item parameters and examinee abilities." (Main paper §4.2)
- VI
- A fast fitting method. It replaces the slow random guessing of MCMC with a simpler shape that it tunes step by step. The Leaderboards paper and tinyBenchmarks both use it."VI approximates the Bayesian posterior with a factorized variational distribution, optimized via KL divergence minimization." (Main paper §4.2)
- PSN
- A fitting method that trains a small neural network to predict right and wrong answers. It does not assume a bell curve, and it gives no error bars."PSN is a neural-network estimator that learns ability and item parameter embeddings, which are passed through an IRT response function to predict binary responses, trained with gradient-based optimization" (Main paper §4.2)
- normal distribution (bell curve)
- The bell-shaped spread: most values near the middle, fewer and fewer toward both ends, the same on both sides."Second, standard estimators commonly assume normally distributed abilities, either explicitly (MML-EM) or through prior specification (Bayesian and VI)." (Main paper §2.1)
- DAD leaderboard (IRT leaderboard)
- A leaderboard that fits IRT to every model's answers on every question, then ranks models by hidden strength and labels each question."we propose Difficulty and Ability Discriminating (DAD) leaderboards that explicitly model both task and submissions jointly, rather than either in isolation." (Leaderboards §1.1)
- feasibility (the answerable share)
- A ceiling λ on a question's chance of being answered right, even by the strongest model. A low ceiling hints the question or its answer key is broken."In the model IRT-feas, if a large fraction of subjects all get an item wrong, everyone's probability of getting the item right is capped at λi. In NLP terms, 1 − λi corresponds to the prevalence of annotation errors that lead to unsolvable items." (Leaderboards §2)
- computerized adaptive testing (picking the next question as you go)
- A test that chooses each next question from the answers so far, as many school entrance tests on computers do."To emulate this setting, we use computerized adaptive testing (Weiss and Kingsbury, 1984) to iteratively select SQuAD items to “annotate.”" (Leaderboards §4.4)
- Fisher information (how much a question tells)
- A number for how much one question's answer narrows down a model's hidden strength. It is largest when the model has a 50–50 chance, and grows with discrimination."To assess IRT's effectiveness in AI benchmark compression, Fisher information F was computed for each item j given each model's estimated capability value" (Main paper §4.3)
- anchor points (stand-in questions)
- A few questions that each stand for a group of similar questions. A new model answers only these, and each answer is weighted by the size of its group."Representative examples, from these clusters, which they call “anchor points”, can then be used to evaluate models on classification tasks more efficiently." (tinyBenchmarks §3.2)
- p-IRT (IRT fill-in estimate)
- The new model answers a few questions. IRT finds its hidden strength from them and predicts its chance on every question it did not answer. Real answers plus predictions give the full score."We call the estimator in (eq:pirt) by Performance-IRT (p-IRT) estimator." (tinyBenchmarks §4.2)
- gp-IRT (blended estimate)
- A weighted mix of the plain score on the chosen questions and the IRT fill-in estimate. The weight depends on how many questions were asked and how wrong IRT tends to be."The idea is to compute a third estimator given by a convex combination of the first two" (tinyBenchmarks §4.2)
- scenario (sub-test)
- One dataset inside a larger benchmark. The Open LLM Leaderboard has six scenarios."Consider that a benchmark is composed of scenarios and possibly sub-scenarios. For example, MMLU and HellaSwag are examples of scenarios of both the Open LLM Leaderboard and HELM" (tinyBenchmarks §2)
- IRT++ (IRT picks plus blending)
- tinyBenchmarks' best method: stand-in questions chosen with IRT, then the blended estimate on top."For each strategy, we evaluate the vanilla variation, i.e., simply using the performance of a test LLM on the (weighted) set of selected examples to estimate its performance on the full benchmark, and “++” variation that adjusts this estimate using the IRT model as described in equation (eq:gpirt)." (tinyBenchmarks §5)
- Open LLM Leaderboard
- A public Hugging Face leaderboard that ran thousands of open models on the same six benchmarks. Its version 1 is the data the main paper and tinyBenchmarks build on."The leaderboard aggregates results from over 6,000 community-contributed models across six benchmark datasets" (Main paper §4.1)
- multidimensional IRT (IRT with several strengths per model)
- IRT where each model has a list of hidden strengths, not just one. Each question says which of them it needs."The two-parameter multidimensional IRT model assumes that the probability of the LLM j getting example i correctly is given by" (tinyBenchmarks §4.1)
- data regime mismatch (AI-versus-school data gap)
- School tests have many students and few questions. AI benchmarks have few models and many questions, and the models' strengths are not spread like a bell curve."Illustration of the data regime mismatch between human testing and AI benchmarking." (Main paper, Figure 1 caption)
- simulation study (test with planted answers)
- You choose the true settings yourself, make fake data from them, fit the method, and check how close it gets to what you chose."Simulation studies, also known as Monte Carlo studies, are the standard methodology for evaluating the performance of statistical methods under controlled conditions." (Main paper §2.2)
- true item parameters (the planted question settings)
- The question settings the simulation starts from. Fitted IRT is scored by how close it gets back to them."Then, the item parameter estimates were treated as the true item parameters in the simulation." (Main paper §4.1)
- replication (repeat)
- One full run of the simulation with fresh random data. Each setting was run 50 times."For each of the 90 conditions, we generated 50 replications." (Main paper §4.1)
- ranking recovery (rank match)
- How well the fitted order of the models matches their true order. 1 means the same order."For model capability, ranking recovery was evaluated using Kendall's rank (τ) correlation between true and estimated capability values." (Main paper §4.3)
- Kendall's τ (rank agreement)
- A number from −1 to 1 for how alike two orderings are. It counts pairs ordered the same way minus pairs ordered the other way, divided by all pairs."For model capability, ranking recovery was evaluated using Kendall's rank (τ) correlation between true and estimated capability values." (Main paper §4.3)
- aggregate score error (average-score error)
- How far the fitted model's predicted benchmark score is from the true one, in accuracy units. 0.025 means 2.5 percentage points."Additionally, we measured aggregate score error: the absolute difference between expected full-benchmark scores under true and estimated parameters" (Main paper §4.3)
- difficulty recovery (difficulty match)
- The correlation between the true and the fitted difficulties of the questions. 1 is a perfect match."Recovery of item-level properties was evaluated using Pearson correlations between true and estimated item parameters, including difficulty recovery and discrimination recovery (2/3PL)" (Main paper §4.3)
- discrimination recovery (separation match)
- The correlation between the true and the fitted discriminations of the questions. 1 is a perfect match."Recovery of item-level properties was evaluated using Pearson correlations between true and estimated item parameters, including difficulty recovery and discrimination recovery (2/3PL)" (Main paper §4.3)
- short benchmark (short test)
- A small set of questions picked from the full benchmark, meant to rank models the same way the full benchmark does."The top 10%, 20%, and 100 items with largest Fisher information averaged across θ̂_i formed the short benchmark." (Main paper §4.3)
- insufficient difficulty coverage (too few matching questions)
- The share of models that have five or fewer questions pitched at their own level. Questions far too easy or far too hard for a model say little about it."insufficient difficulty coverage, defined as the proportion of evaluated models with 5 or fewer items whose difficulties were within 0.2 of their true capabilities" (Main paper §5.2)
- item-level data (per-question records)
- For each question: the question itself, how it was given to the model, the model's answer, and its score. Not just the final average."Our position is that valid evaluation requires empirical evidence from item-level benchmark data, including item content, test conditions, model responses, and item-level score statistics" (OpenEval Abstract)
- data contamination (test questions seen in training)
- When a benchmark's questions were in a model's training data, so a high score may be memory, not skill at the task."Both intentional and inadvertent test-train overlap can secretly lead to unfair evaluations unless explicitly reported by developers" (OpenEval §2.2)
- benchmark saturation (a test grown too easy)
- When nearly every new model gets nearly every question right, so the test can no longer tell models apart."Some benchmarks have gradually become too easy to distinguish between the latest models" (OpenEval §2.2)
- schema (shared record format)
- The fixed list of fields every record must have, so data from different groups can be combined."OpenEval therefore addresses the infrastructure challenge through a unified, item-centered schema, as illustrated on the right side of Fig. 8 and detailed in App. A, in which each data entry represents a unique item." (OpenEval §4)
- CTT
- The older, simpler way to describe questions: difficulty is the share of models that got it right, discrimination is how well getting it right tracks the score on the rest of the test. No hidden strengths are fitted."CTT measures item difficulty and discrimination directly from observed score matrices with minimal assumptions, making it readily applicable to large-scale, heterogeneous AI benchmark data" (OpenEval §5.1)
- MMLU-Pro
- A harder version of MMLU, with more wrong-answer options and expert-reviewed questions."MMLU-Pro is an enhanced variant of MMLU intended to increase difficulty and reduce noise via additional distractors, more careful item curation, and expert item review." (OpenEval §5.2)
- IFA
- A method that finds which questions models tend to get right or wrong together, and so which hidden traits the test really measures."The second is Item Factor Analysis (IFA), which provides evidence about a test’s internal structure" (OpenEval §5.1)
- construct (the trait a test aims at)
- The thing a test is meant to measure, such as reading or deduction. It cannot be seen directly."A Construct refers to a theoretical, unobservable attribute or trait (e.g., a perceived AI capability) that a test is intended to measure." (OpenEval §2.1)
- tinyBenchmarks
- The paper, and the small benchmark versions it released: 100 questions per scenario, with IRT tools to estimate the full score."Based on our findings we release tiny (100 examples per scenario) versions of every considered benchmark and IRT-based tools for further improving the performance estimation." (tinyBenchmarks §1)
- MMLU
- A large multiple-choice test of school and college subjects, one of the six Open LLM Leaderboard benchmarks."MMLU is a multiple choice QA scenario consisting of 57 subjects (subscenarios) comprising approx. 14K examples." (tinyBenchmarks §5)
- OpenEval
- The repository the OpenEval paper built: millions of model answers to benchmark questions, all in one format, open to contributions."we propose an item-centered repository, OpenEval, designed as a community-driven data infrastructure to standardize benchmark items with model responses, metric scores, and other associated information across different tasks, formats, and evaluation harnesses." (OpenEval §4)
- SQuAD 2.0
- A question answering test where the answer is a span of a given passage. Its public leaderboard is the data the Leaderboards paper uses."Throughout the paper, we use the question answering (QA) benchmark SQuAD 2.0 (Rajpurkar et al., 2018)." (Leaderboards §1.1)
- HellaSwag
- One of the six Open LLM Leaderboard benchmarks. After cleaning it has 5,711 questions, the second most of the six."5,221 × 5,711 for HellaSwag" (Main paper §4.1)
- skewness (lopsidedness)
- How lopsided a spread is. Zero means both sides match, as in a bell curve. A large value means a long tail on one side."absolute sample skewness statistic of the true capabilities" (Main paper §5.2)
- TruthfulQA
- One of the six Open LLM Leaderboard benchmarks. After cleaning it has 644 questions, the fewest of the six."The retained matrices' dimensions (N models × J items) were as follows: 5,222 × 644 for TruthfulQA" (Main paper §4.1)
- GSM8K
- A benchmark of math problems, one of the six Open LLM Leaderboard benchmarks. After cleaning it has 1,306 questions."6,068 × 1,306 for GSM8K" (Main paper §4.1)
- bAbI Task 15
- A small made-up-story test of deduction: “Wolves are afraid of mice. Emily is a wolf. What is Emily afraid of?” Answer: mouse."bAbI Task 15 aims to assess basic deductive reasoning via inheritance of properties." (OpenEval §5.3)