Predicting Language Models' Success at Zero-Shot Probabilistic Prediction
A language model can read one row of a table and give the chance that its label is yes. Before you have any labels, can you tell whether it will do this task well?
key idea what the paper found what is lost, or a limit
chapter 1
The question in one picture
An LLM reads one row of a table, written as text. A question follows, with two answers, A and B. The model's probability for answer A is its prediction for that row. §3.1 A.12 The paper calls this probability a risk score. §1
One row in, one risk score out §3.1
The prompt describes the dataset, gives one row as text, and asks a question with two answers. A.12
The model's probability for answer A is the risk score for that row. §3.1
The same model, GPT-4o-mini, on two tasks: one ranks people well, the other is worse than a coin flip. A.2
This is the paper's question: can unlabeled rows alone tell you which kind of task you have? §1
People with the same features can still have different outcomes, so the answer is a chance. The paper calls tasks like this probabilistic prediction. §1 The model sees no labeled examples first, so its predictions are zero-shot. §1
On uciheart, GPT-4o-mini reached an AUC of 0.8756. AUC scores how well the model ranks rows: 1 is perfect, and 0.5 is random guessing. On telescope, it reached 0.4322, worse than random. A.2 Both scores need labels, and a zero-shot model is meant to save the cost of labeling. §1
So the paper asks: given only unlabeled data, can you tell in advance how well the model will do? §1
The answer, in short
- Success varies a lot, even between tasks from the same table. §4.1
- Asking the model about itself is a weak signal for every model except GPT-4o. §4.3
- The spread of the model's risk scores on unlabeled rows was the strongest signal tested. §4.3
- Row by row, the scores are badly scaled, yet scores near 0 or 1 are right more often. §4.2
Why can you not test the model on a few tasks and trust it on the rest?
Its success varies a lot from task to task, even inside one dataset. A good result on one task says little about the next. §4.1
Why does the paper look for signals that need no labels?
Labels are costly. Avoiding that cost is the reason to use a pretrained model in the first place. §1
chapter 2
What you need first
Where a risk score comes from
The model replies with one letter, A or B. Its risk score is read from its probability for each letter, not from a number it writes. §3.1 A.12 Each dataset gives 1,000 random rows, turned into prompts with the folktexts library. §3.1 In a second prompt, the model also writes how sure it is, from 0.0 to 1.0. The paper calls this a verbalized confidence score. §3.1 A.12
Two ways to score a task
Take one row whose label is yes and one whose label is no. AUC is the chance that the model gives the yes row the higher risk score. An AUC of 1 is perfect, and 0.5 is random guessing. AUC is the paper's main measure of how well a model does. §3.1
AUC only checks the order of the scores. A second question is whether the numbers are right. Of all rows scored 0.3, about 30% should have the label. A calibration curve plots this for one task. A perfect model lies on the diagonal. Figure 5 The expected calibration error averages the gap into one number. §3.1
Two levels
The paper asks its question at two levels. At the individual level, the question is which rows the model will get right. At the task level, the question is which whole tasks it will do well on. A task is one dataset plus one column to predict. §1
Earlier work looked at the individual level. There, confidence supports abstention: a person checks the doubtful rows, or they are dropped. §1 The paper's new question is at the task level: is this whole task worth giving to the model? §1
A model squares every risk score, which keeps them between 0 and 1 and in the same order. What happens to its AUC and its expected calibration error?
The AUC stays the same, because the order did not change. The expected calibration error changes, because the numbers change while the labels do not. For a well-scaled model, it gets worse.
What is the difference between a risk score and a verbalized confidence score?
The risk score is read from the model's probabilities for the letters A and B. The verbalized confidence score is a number the model writes about how sure it is. §3.1
chapter 3
What the paper does
Many tasks
The paper uses 31 public tables from social surveys, finance, medicine, transport and more. Each table comes with one yes-or-no column to predict, its main task. §3.1 It tests four models that report the probability of each answer letter: GPT-4o-mini, GPT-4o, Mistral-7b-Instruct-v0.1 and Llama-3.1-8b-Instruct. §3.1
It also hides other columns, one at a time, and asks the model to predict each from the rest. §3.1 This gives 285 more tasks, so 316 in all. §3.1 §4.3
How a hidden column becomes a yes-or-no label
A number column becomes "above its median or not". A category column becomes "equal to its most common value or not". §3.1 Columns with over 70% missing values are skipped. So are category columns where over 99% or under 10% of rows have the most common value. §3.1 The paper samples 10 columns per table and reports 285 tasks from them. §3.1 It does not say why this is fewer than 31 × 10 = 310. A likely reason (not from the paper) is that some tables have fewer than 10 usable columns.
The signals
Each signal guesses a task's AUC without its labels. There are three kinds. §3.2
- Task-level confidence elicitation: describe the dataset and its target, then ask the model how well it will do. It may guess its own AUC, the direct AUC prediction. Or it may rate itself, in integer scoring or decimal scoring. §3.2
- Aggregating individual-level confidence: run the model on unlabeled rows, then summarize its outputs in one number, such as a mean. One summary is average confidence. Another is the average Maximum Class Probability (MCP): how close the scores sit to 0 or 1. §3.2
- Masking: use the model's mean AUC on the hidden-column tasks of the same table. §3.2
Three kinds of signal, and the test §3.2
The authors had seen one common failure: nearly the same answer for every row. §3.2 The standard deviation of risk scores catches it: a small value means the model barely tells the rows apart. §3.2
How a signal is judged
For each model, the paper plots every signal against the real AUC, one point per dataset. Each point uses the dataset's main task, so each dataset has one AUC. It fits a straight line and reports R²: how much of the variation in AUC the line explains. Figure 7
The formulas, and a fourth kind of signal
For task j with n rows, write p̂ for a row's risk score and c for its verbalized confidence score. Then average confidence is the mean of c over the n rows. Average MCP is the mean of the larger of p̂ and 1 − p̂. §3.2 The standard deviation of risk scores is the standard deviation of p̂ over the rows. The standard deviation of c is a fourth summary. §3.2
The paper also goes past single numbers. It cuts each task's risk scores into 201 percentile values. Then it trains XGBoost, a standard tree-based model, to predict the task's AUC from them. §4.3 It uses 5-fold cross-validation and keeps all tasks from one dataset in the same fold. So no table is in both training and testing. §4.3
Why does the standard deviation of risk scores need no labels?
It is computed only from the model's own outputs on the rows. The labels are never read. §3.2
Why might masking seem like a good signal at first?
If the model predicts the other columns of a table well, it might understand that table. Then it might predict the label well too. §3.2
chapter 4
What they found
Success varies, even inside one table
What share of the variation in GPT-4o-mini's AUC across tasks do you think comes from the dataset?
The part below opens after your guess.
Figure 2 from the paper Figure 2 open full size
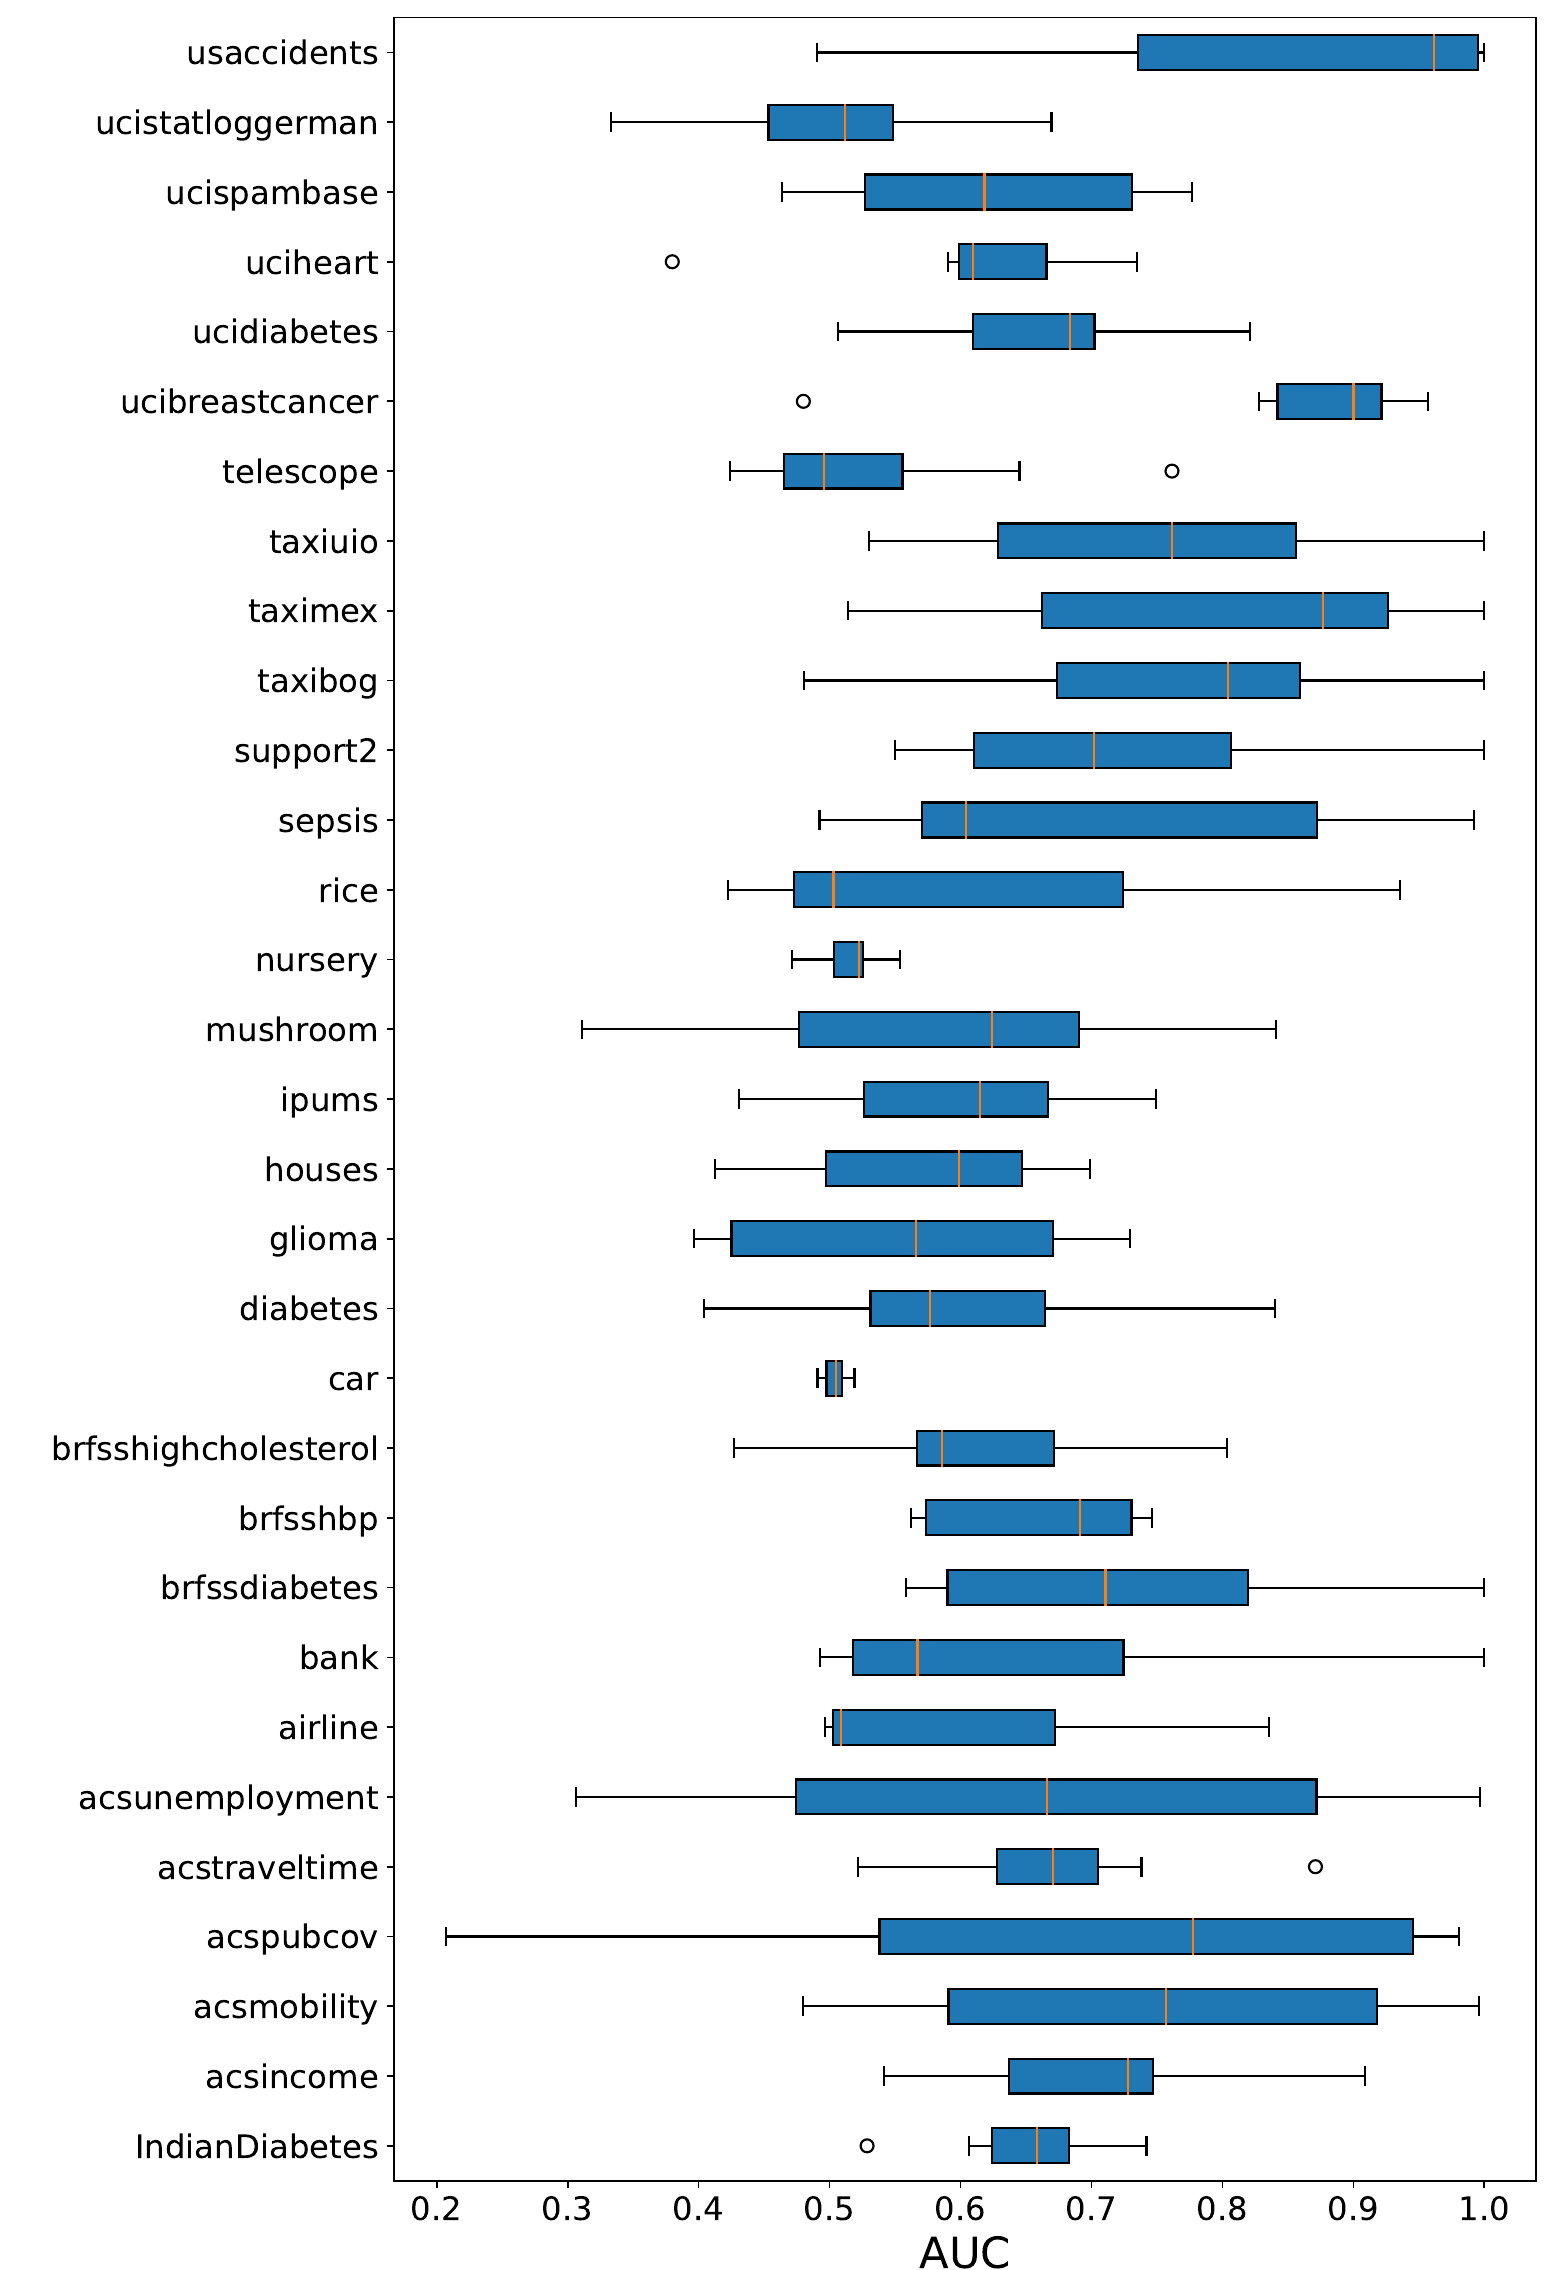
Each row is one dataset. Each box and its whiskers cover that dataset's tasks, one task per predicted column, for GPT-4o-mini.
The line at 0.5 is random guessing. Left of it is worse than random.
Acspubcov: its tasks run from about 0.2 to near 1.0. One dataset holds both strong and weak tasks.
Telescope: most of its tasks sit near 0.5.
Many datasets have tasks below 0.5 and above 0.9. §4.1 The paper measures this with the intra-class correlation coefficient: the share of variation in AUC at the dataset level. It is only 19% for GPT-4o-mini §4.1, and 12.80% for Llama. §4.1
So doing well on some tasks from a table says little about a new task from the same table. §4.1
Medians, and columns that are harder than others
The median AUC was 0.7232 for GPT-4o-mini and 0.7080 for Llama. §4.1
Part of the spread may come from the columns, since some are harder to predict. To check, the paper divides the model's AUC by the AUC of an XGBoost model trained with labels. §4.1 After that, the intra-class correlation coefficient rises to 53.02% for GPT-4o-mini and 47.68% for Llama. §4.1 So, after allowing for difficulty, skill does differ between subject areas. §4.1
The two models also agree on which tasks go well. Their AUCs have an R² of 0.497 with each other. Figure 3 That is higher than either model's R² with XGBoost. §4.1
The paper's text defines the intra-class correlation coefficient as variance "within datasets vs overall". Its numbers read as the share at the dataset level: 19% by dataset, with 81% within datasets. §4.1 This page follows the numbers.
The spread of the scores is the best signal tested
Which signal do you think tracked GPT-4o-mini's real AUC best?
The part below opens after your guess.
Figure 7 from the paper: eight signals against real AUC, GPT-4o-mini Figure 7 open full size
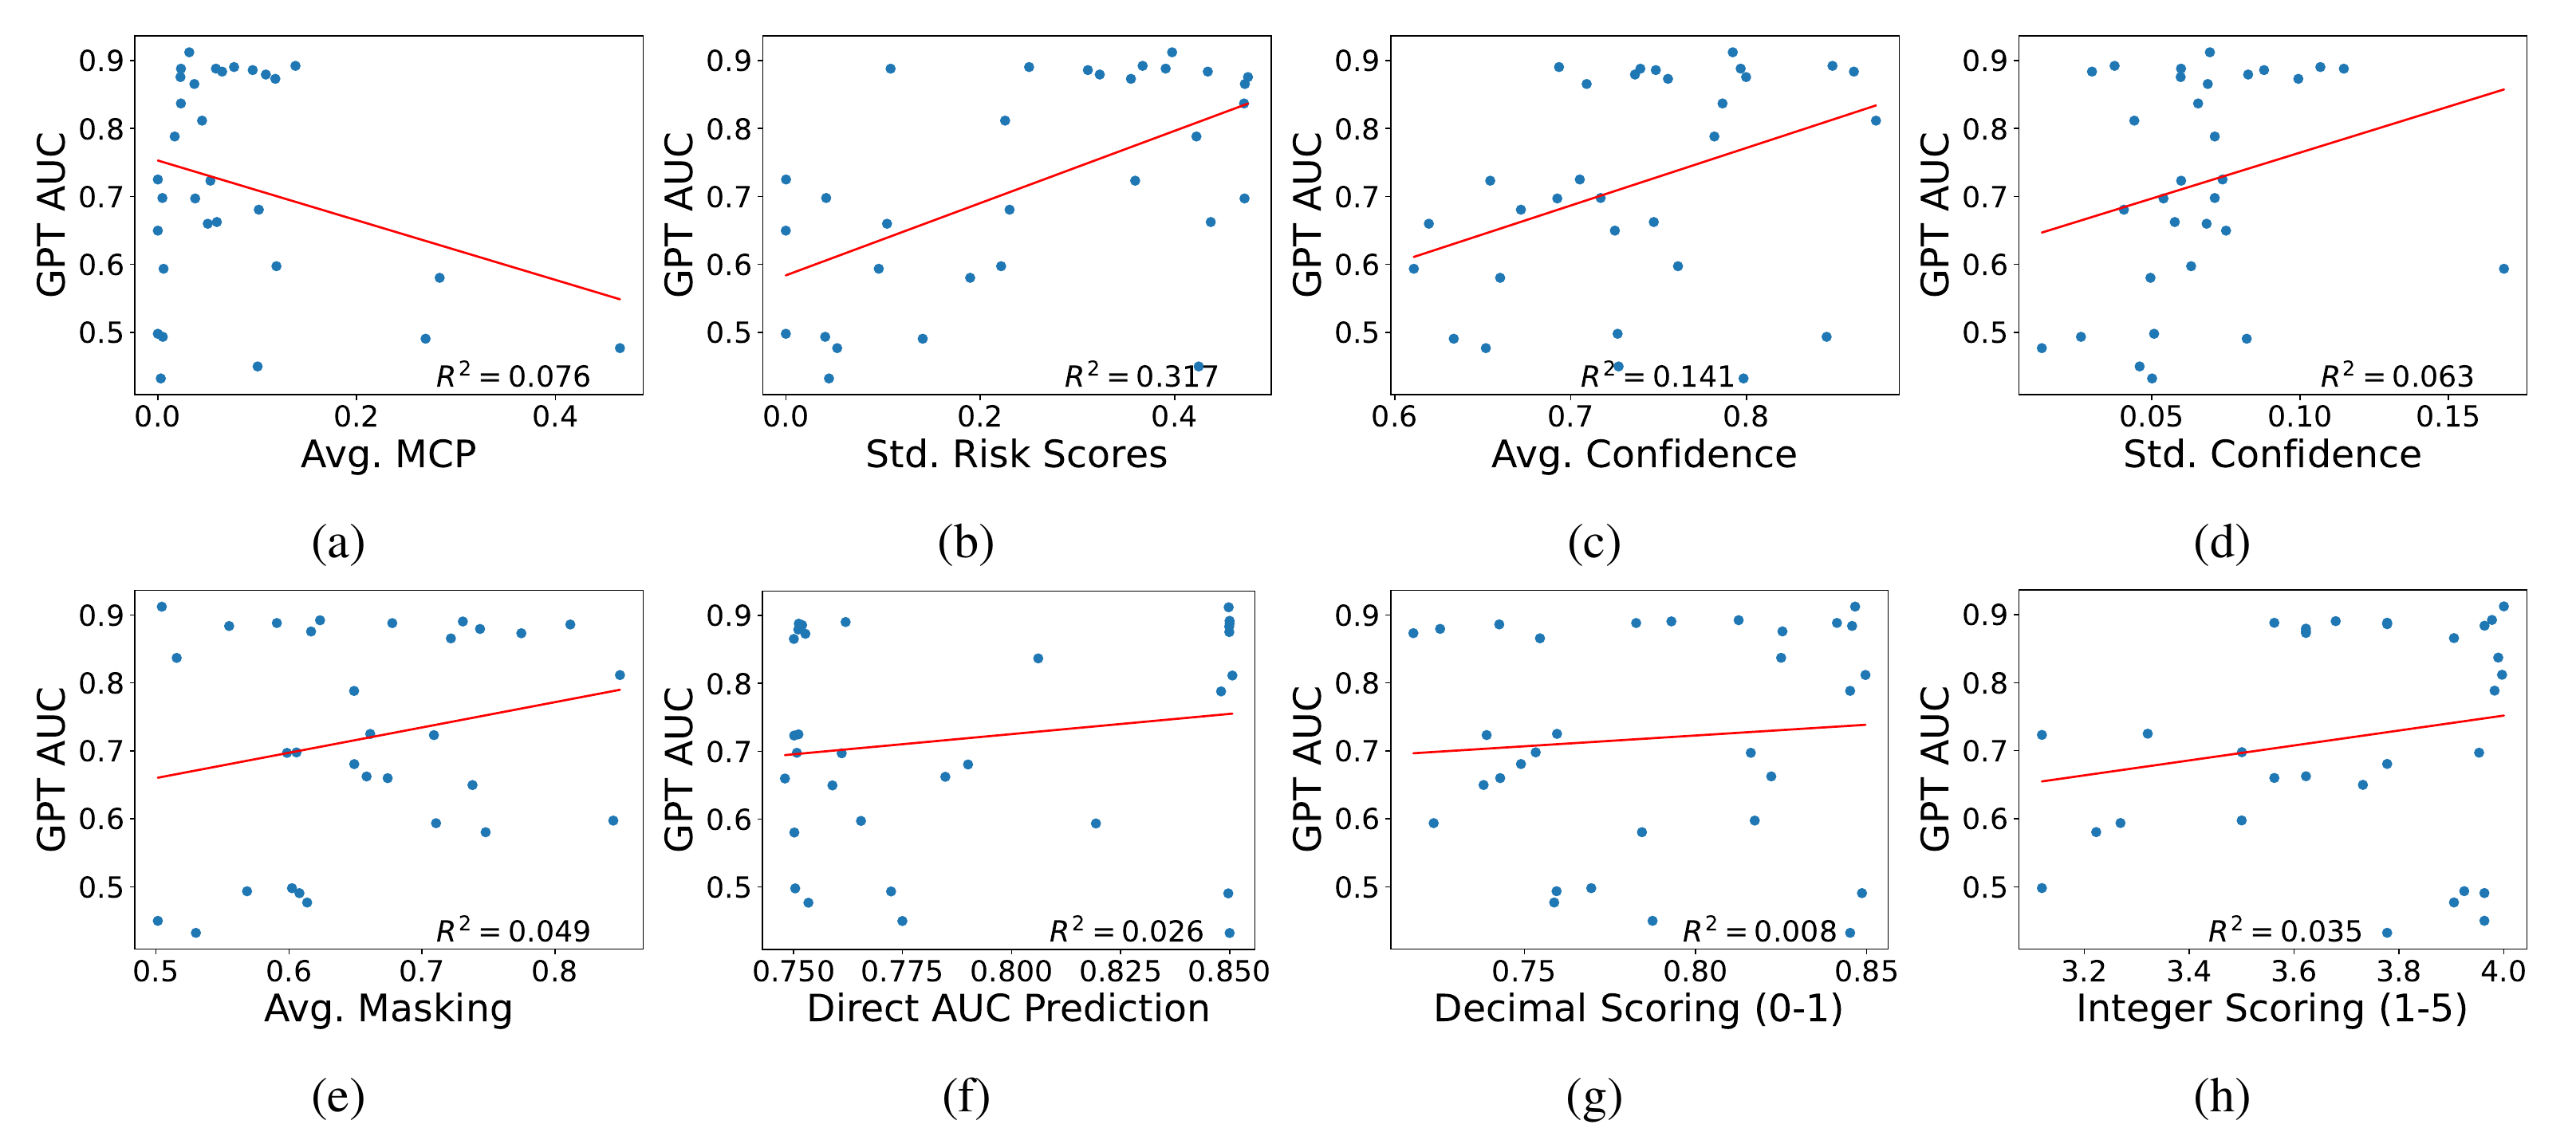
Each point is one dataset's main task. Panel b: the standard deviation of risk scores has the best fit, R² = 0.317.
Panels f to h: the three ways of asking the model about itself. Their R² is 0.035 or less.
Panel e: masking, with R² = 0.049. It did poorly for every model. §4.3
For GPT-4o-mini, the standard deviation of risk scores had an R² of 0.317. Figure 7 The three ways of asking the model about itself had 0.035 or less. Figure 7 For each of the four models, no other signal had a higher R² than the standard deviation of risk scores. For GPT-4o it was 0.605, and for Llama 0.270. §4.3
The main signal, in motion §4.3
A made-up example. The model scores every unlabeled row of two tasks. In the first, the scores split toward the two ends. In the second, every row gets nearly the same score.
The standard deviation of risk scores is large for task 1 and small for task 2. No label is needed to see this. §3.2
The paper's numbers: datasets with a large spread had a much higher average AUC. §4.3
As a screen for GPT-4o-mini, datasets with a standard deviation of risk scores of at least 0.4 had an average AUC of 0.8417. Over all datasets it was 0.7186. §4.3 But some tasks with a large spread still did badly. §4.3
The exception: GPT-4o
GPT-4o is the one model whose self-ratings worked somewhat. It had the highest median AUC, 0.82. §4.3 Its direct AUC prediction, decimal scoring and integer scoring had an R² from 0.206 to 0.303. Its standard deviation of risk scores, at 0.605, still did better. Figure 8 The paper suggests that a stronger model is better at judging its own success. §4.3
The full set of scores, Figures 9 to 11
Figure 9 from the paper: all 316 tasks Figure 9 open full size
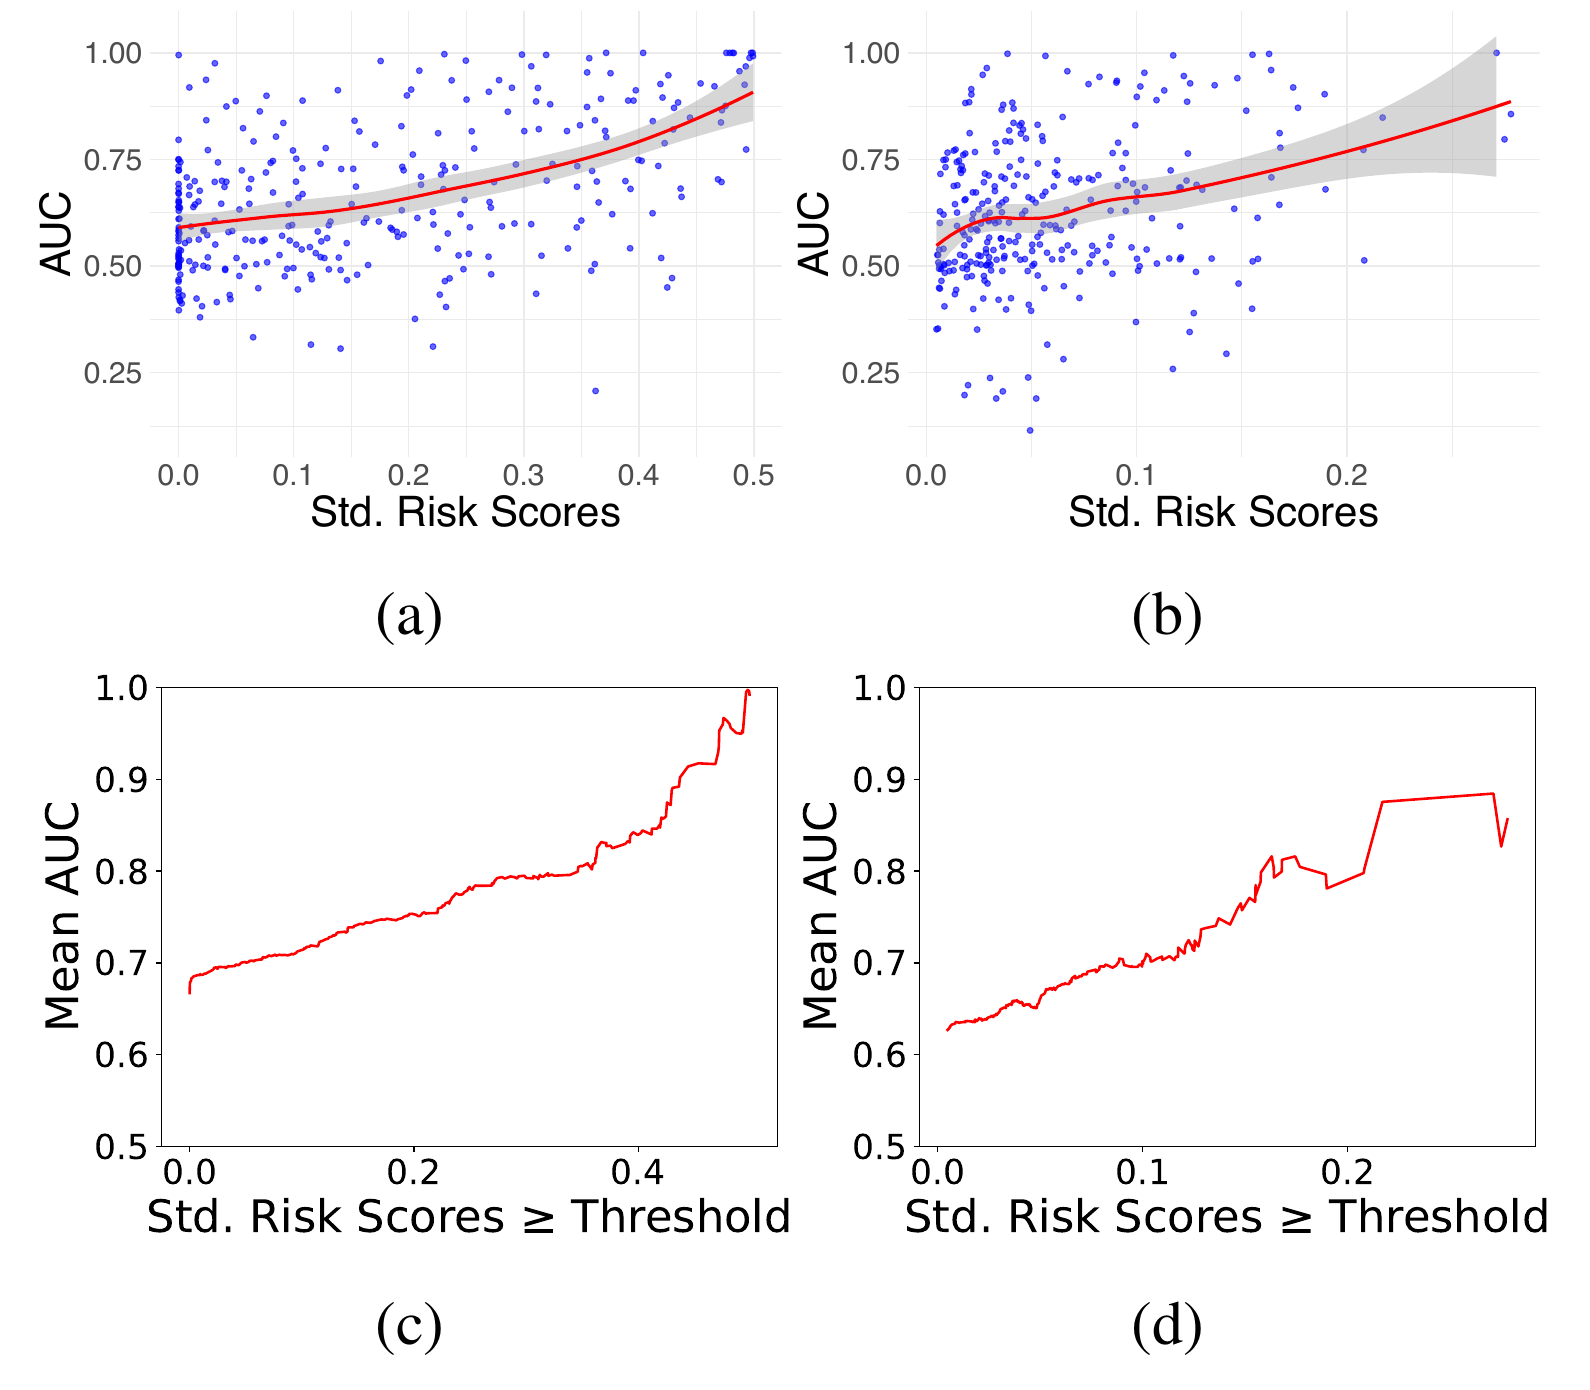
Panel a, GPT-4o-mini: each point is one task, main or hidden-column. AUC tends to rise with the standard deviation of risk scores, with much scatter.
Panel c: the mean AUC of all tasks above a threshold. With no threshold it is under 0.7.
Raise the threshold to 0.4 and the mean is near 0.85. Panels b and d show the same for Llama-3.1-8b-Instruct.
The pattern holds across all 316 tasks. Panels c and d raise a minimum standard deviation of risk scores and track the mean AUC of the tasks left. The mean rises as the minimum rises. §4.3
The XGBoost model that reads all 201 percentiles fits a little tighter than the spread alone, mostly for Llama. §4.3 So the shape of the scores holds some information beyond their spread.
Figure 11 from the paper: what a good task's scores look like Figure 11 open full size
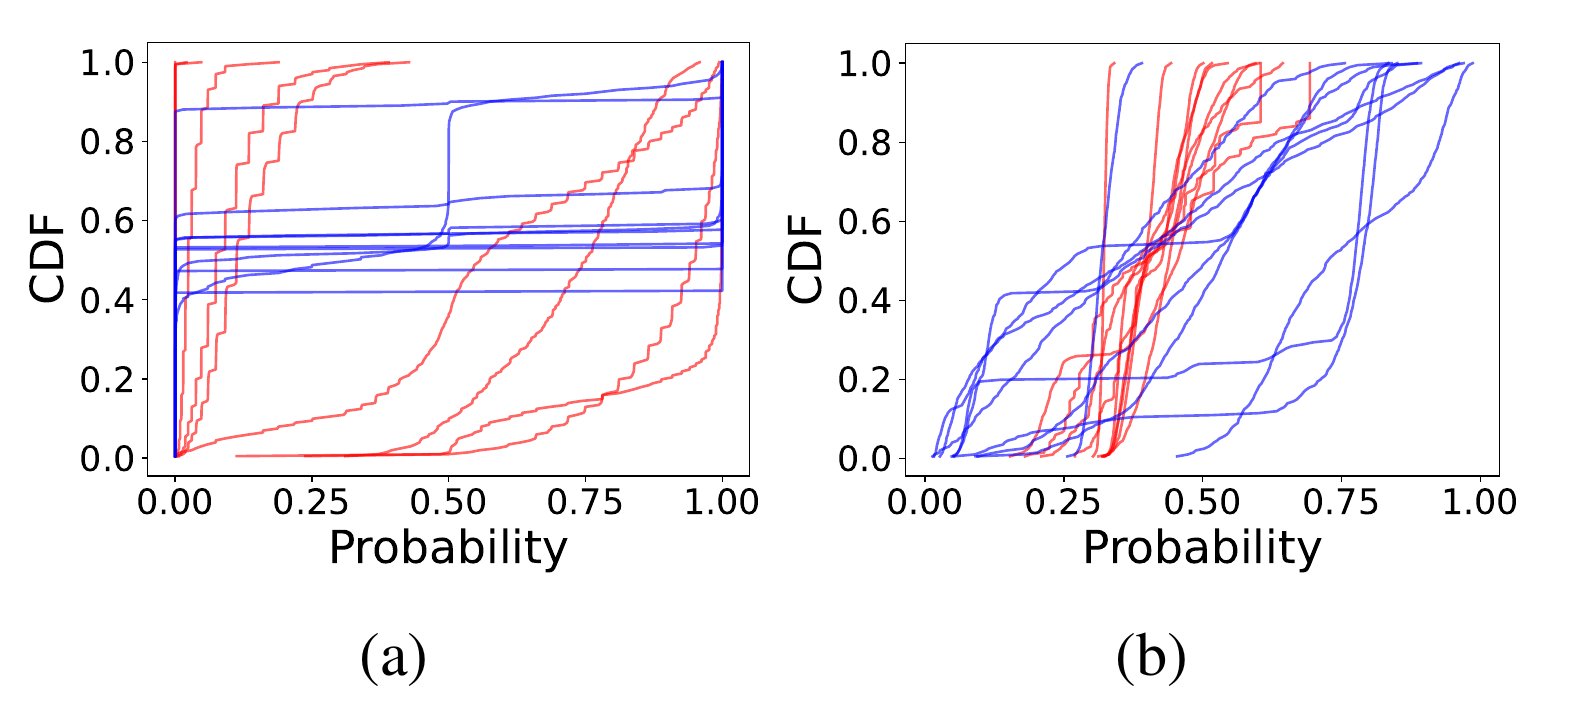
Blue: the 10 tasks with the highest AUC predicted by XGBoost. Red: the 10 lowest. Panel a, GPT-4o-mini: the blue curves jump at 0 and at 1. On its best tasks, the scores sit near 0 or near 1.
Panel b, Llama-3.1-8b-Instruct: the red curves rise steeply in a narrow band. On its worst tasks, most scores are close together.
Its blue curves rise slowly across a wide range. On its best tasks, the scores are spread widely.
The shape of a good task differs by model. For GPT-4o-mini, the best tasks have scores clustered near 0 or 1. For Llama, the best tasks have broad, high-spread scores, and the worst have tight ones. §4.3 The paper concludes that the signs of a good task must be read model by model. §4.3
The text calls 0.7186 "the average AUC over all datasets". That matches the average AUC of GPT-4o-mini on the 31 main tasks, given as 0.72. §4.3 Figure 9c, over all tasks, starts below 0.7. So the two numbers may come from different sets of tasks. Check the released code before you reuse the comparison.
Row by row: the wrong scale, but a useful order
Earlier work found that LLM risk scores are overconfident. What do you think the calibration curves here most often showed?
The part below opens after your guess.
Figure 5 from the paper: calibration curves Figure 5 open full size
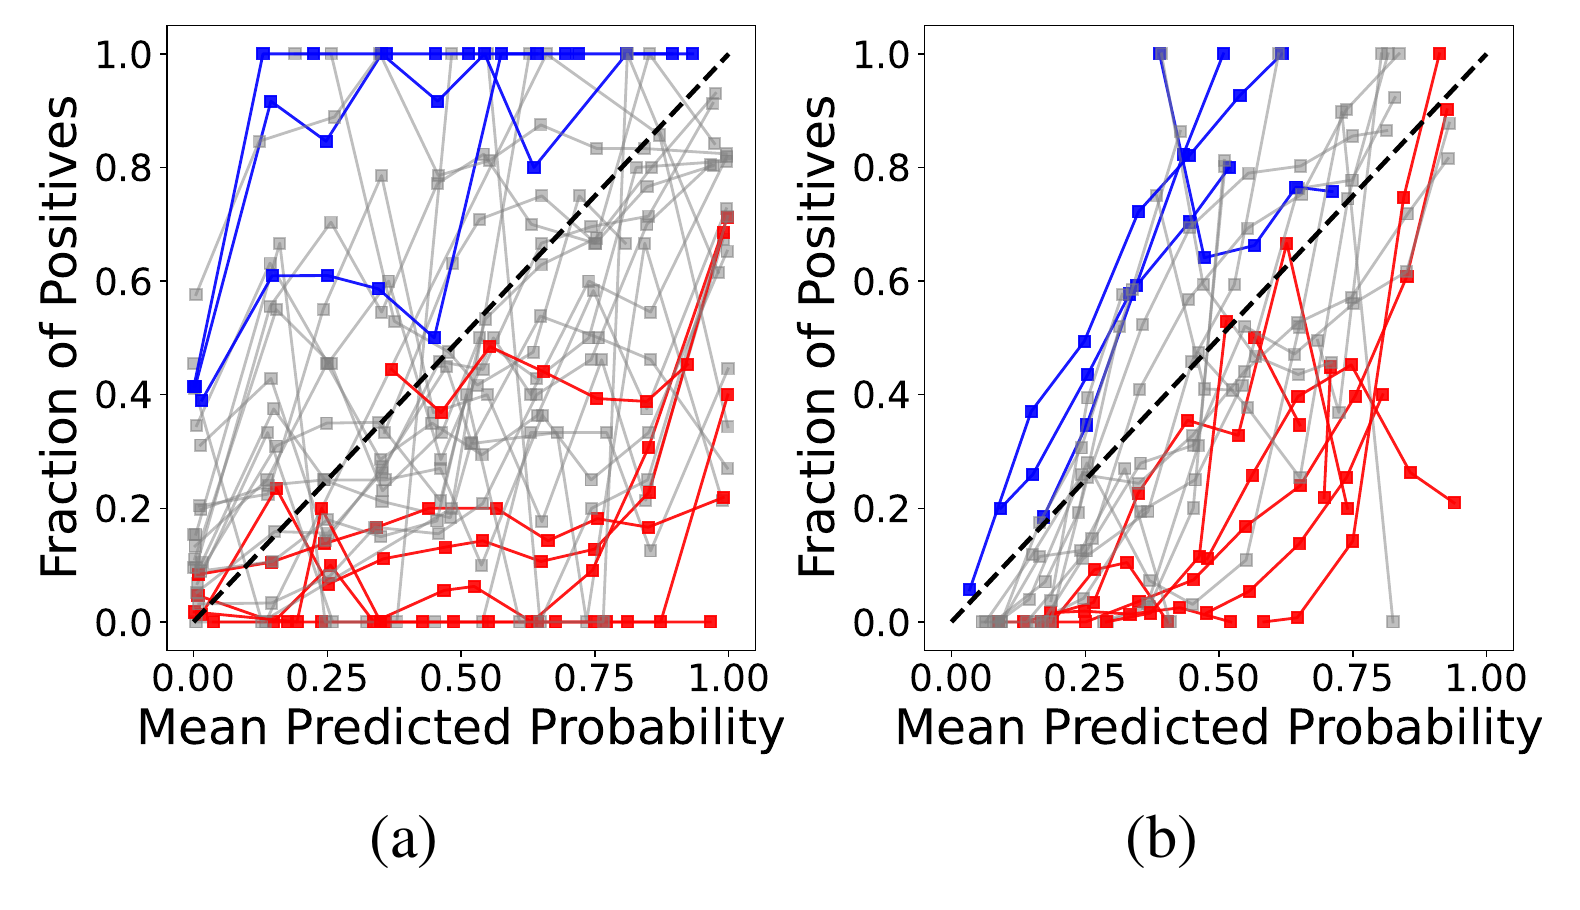
Panel a is GPT-4o-mini, panel b is Llama-3.1-8b-Instruct. Each curve is one task. A calibrated task would follow the dashed diagonal.
Blue curves stay above it: more rows have the label than the scores say. The scores are too low.
Red curves stay below it: the scores are too high. Gray curves cross the diagonal.
Many calibration curves stay entirely above or below the diagonal. The paper reads this as a problem of scale: the model ranks rows well but misjudges how common the label is. §4.2
The order still helps with abstention. The paper tests this as failure prediction: does the MCP of a row predict whether the model got it right? It does, best on tasks where the model did well to begin with. §4.2
Figure 6, and the size of the scale errors
Figure 6 from the paper: failure prediction Figure 6 open full size
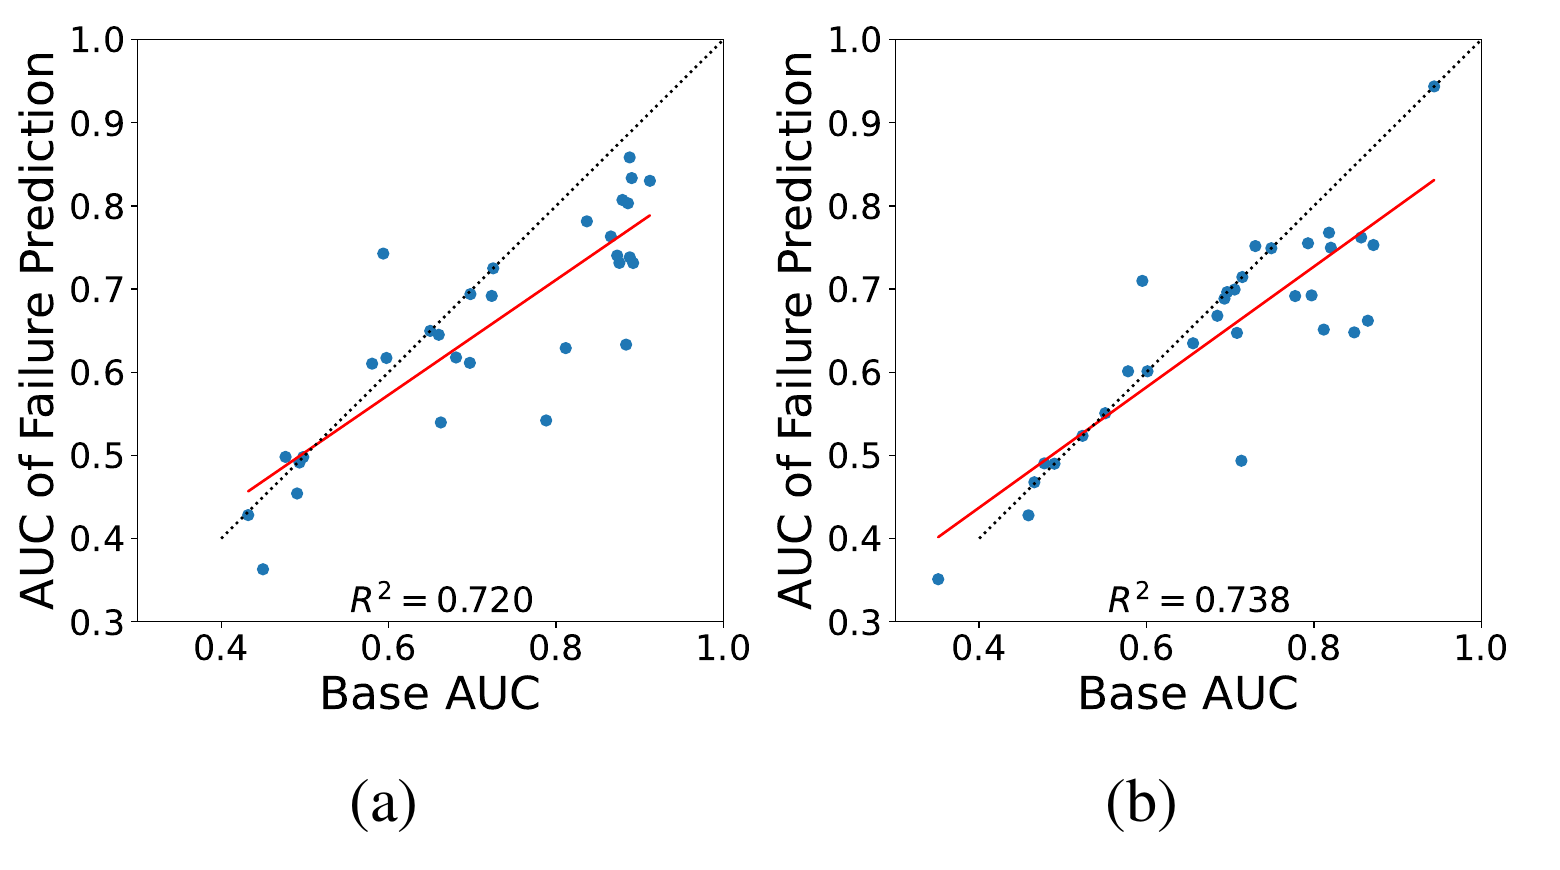
Each point is one dataset's main task. Across: the model's AUC on the task. Up: how well MCP picks out the rows it gets wrong.
Where GPT-4o-mini does well, its confidence also tells right rows from wrong ones.
Where it is near random, its confidence is too.
R² = 0.720 for GPT-4o-mini and 0.738 for Llama-3.1-8b-Instruct.
The median expected calibration error was 0.2426 for GPT-4o-mini and 0.1722 for Llama. §4.2
The AUC of failure prediction ran from about 0.4 to near 0.9. §4.2 Its R² with the task's own AUC was 0.720 for GPT-4o-mini and 0.738 for Llama. Figure 6
A task's calibration curve sits above the diagonal everywhere. Can the model's AUC on it still be high?
Yes. AUC depends only on the order of the scores. The scores are too low, but their order can still be right. §4.2
chapter 5
What this does not show
The paper states these limits itself. Limitations
- Seen data. The 31 tables are public, so the models may have seen them in training. The signals might work differently in a domain no model has seen. Limitations
- Models. Only models that give token probabilities were tested. Larger models, or ones trained in other ways, may behave differently. Limitations
- Prompts. Every task used one fixed prompt format. Other prompts, few-shot examples and chain-of-thought were not tested. Limitations
- Not a replacement for labels. The signals can rank tasks to try first or screen out weak ones. They do not replace a check on labeled data where errors matter. §5 A.14
Memorization, in more detail
The paper argues the models did not copy rows from memory. If they had, AUC would not vary so much between columns of one table. Limitations Writing rows as text, not as the original file, may also disturb memorization. Limitations But a model may still do better on tasks like ones it saw often in training. The paper says this could help in practice, yet it limits how far the results carry over. Limitations
Why does the paper say these signals should not replace testing on labeled data?
Why do public datasets limit what the results show?
The models may have seen the data in training. The signals might work differently for data no model has seen. Limitations
chapter 6
Questions people ask
Short answers to common questions. Each one points back to the paper.
What is zero-shot prediction with an LLM?
An LLM reads one row of a table, written as text, and then a question with two answers. Its probability for answer A is the prediction for that row. §3.1 The model sees no labeled examples first, so the predictions are zero-shot. §1
Can an LLM predict table data well?
It depends on the task. GPT-4o-mini reached an AUC of 0.8756 on uciheart. On telescope, it reached 0.4322, worse than random. A.2 Success varies a lot, even between tasks from the same table. §4.1
What is an AUC?
It is the chance that the model gives a yes row a higher risk score than a no row. An AUC of 1 is perfect, and 0.5 is random guessing. §3.1
What is a calibration curve?
It plots, for one task, how often rows with a given score really have the label. A perfect model lies on the diagonal. Figure 5 Many curves here stayed entirely above or below it. The paper reads this as a problem of scale. §4.2
How can you tell if an LLM will work on a task?
The paper tested signals that need no labels. The spread of the model's risk scores was the strongest signal tested. §4.3 For GPT-4o-mini, its R² was 0.317, against 0.035 or less for asking the model about itself. Figure 7
keep it
This page has 10 check-yourself questions. The review page asks them again after 1, 3, 7 and 21 days, one at a time. You can also download them for Anki.
chapter 7
Words to know
Hover or tap any underlined word on the page to see its entry. These are the terms this page uses, in the order it introduces them.
- risk score (predicted chance)
- The model's probability, from 0 to 1, that one row has the label."We refer to tasks with this property as probabilistic prediction, and the predicted probabilities from the LLM as risk scores." (§1)
- probabilistic prediction (predicting a chance)
- A task where the same inputs can lead to different outcomes, so the best answer is a chance, not a sure yes or no."the label is not determined fully by the input: people with identical features may have different outcomes. We refer to tasks with this property as probabilistic prediction" (§1)
- zero-shot (with no labeled examples)
- The model predicts with no labeled examples from the task, using only what it learned in pretraining."leveraging the world knowledge encoded by their pretraining corpora to make zero-shot predictions in domains without any labeled data" (§1)
- verbalized confidence score (stated confidence)
- A number from 0.0 to 1.0 that the model writes to say how sure it is of its answer."Each model also generates a verbalized confidence score per row" (§3.1)
- calibration curve
- A plot for one task: rows are grouped by their score, and each group's average score is plotted against how often the label really occurs. A calibrated model lies on the diagonal.not defined in the paper
- expected calibration error (average scale error)
- The average gap between the scores and how often the label really occurs. 0 means the scores match exactly.not defined in the paper
- individual level (row level)
- Questions about single rows: which rows will the model get right?"at the individual level, referring to which examples an LLM is likely to predict accurately" (§1)
- task level (whole-task level)
- Questions about whole tasks: on which dataset and column will the model do well?"at the task level, referring to which overall prediction problems, defined by a dataset and outcome variable, the LLM is likely to perform well on" (§1)
- abstention (holding back doubtful answers)
- Not using a prediction the model is unsure of: a person checks it, or it is dropped."Abstention methods use measures of individual-level confidence to flag dubious predictions that should be examined manually by a human expert, or ignored altogether" (§1)
- task-level confidence elicitation (asking the model about itself)
- Describe the dataset and target to the model and ask how well it will do. No rows are used."Perhaps the simplest strategy to predict LLMs' performance at a new task is to ask the LLM itself whether it will perform well" (§3.2)
- direct AUC prediction (guess-your-AUC question)
- Ask the model what AUC it will get on the task."Direct AUC prediction asks the LLM to output a prediction of its own AUC at the task." (§3.2)
- integer scoring (1-to-5 rating)
- Ask the model to rate its confidence on the task from 1 to 5."Integer scoring asks the LLM to rate its confidence at the task as a number between 1 (no confidence) and 5 (full confidence)." (§3.2)
- decimal scoring (0-to-1 rating)
- Ask the model to rate its confidence on the task from 0.0 to 1.0."Finally, Decimal scoring asks the LLM for a continuous rating between 0.0 (no confidence) and 1.0 (full confidence)." (§3.2)
- aggregating individual-level confidence (summarizing the row outputs)
- Run the model on unlabeled rows, then summarize its outputs for the whole task in one number, such as a mean."One natural strategy is to aggregate these individual-level measures of uncertainty to the task level, reasoning that LLMs will perform well on tasks where they are confident in many individual examples." (§3.2)
- average confidence (mean stated confidence)
- The mean of the model's stated confidence over the rows of a task."First, average confidence, defined for task j as" (§3.2)
- Maximum Class Probability (certainty of a score)
- For one row, the larger of the risk score and 1 minus it. It is 1 when the score is 0 or 1, and 0.5 when the score is 0.5."This measures how close predictions are to 0 or 1, which is a proxy for confidence." (§3.2)
- masking (the other-columns test)
- Hide other columns of the same table one at a time, let the model predict each, and use its average AUC on them as the guess."The masking strategy takes the average of the AUCs in these simulated tasks as a proxy for the AUC from predicting the true label y." (§3.2)
- standard deviation of risk scores (spread of the risk scores)
- How spread out the model's risk scores are over the rows of one task. It is small when the model gives every row nearly the same score."Finally, we include two additional metrics, standard deviation of confidence and standard deviation of risk scores, the empirical standard deviations of the sets" (§3.2)
- R² (share explained by the line)
- How much of the up and down in one number a straight line through another number explains. 0 is none, 1 is all.not defined in the paper
- intra-class correlation coefficient (share at the dataset level)
- The share of the variation in AUC that comes from which dataset a task belongs to."we compute an intra-class correlation coefficient, defined as the ratio of the variance in AUC within datasets vs overall, measuring the fraction of variance at the dataset level" (§4.1)
- failure prediction (spotting wrong answers)
- Using a confidence signal to sort rows into those the model likely got right and those it likely got wrong."examining the degree to which MCP, a proxy of confidence in the predicted label, predicts individual-level accuracy, a task referred to by (Xiong et al., 2023) as failure prediction" (§4.2)
- LLM (language model)
- A large language model: a model trained on a lot of text that answers in text."Recent work has investigated the capabilities of large language models (LLMs) as zero-shot models for generating individual-level characteristics" (Abstract)
- uciheart
- A UCI dataset of patients. The task: predict a heart disease diagnosis.App. A.1
- AUC (ranking score)
- The chance that the model gives a random yes row a higher score than a random no row. 1 is perfect, 0.5 is random guessing.not defined in the paper
- telescope
- A UCI dataset of telescope readings. The task: tell a gamma signal from a cosmic ray event.App. A.1
- GPT-4o-mini
- A small OpenAI model, used through its API. It is the paper's main example.§3.1
- GPT-4o
- A larger OpenAI model, used through its API. The paper calls it the newest and largest model it studies.§3.1
- folktexts
- A software library from earlier work that writes table rows as text prompts and reads risk scores from a model.§3.1
- Mistral-7b-Instruct-v0.1
- An open model from Mistral AI with 7 billion parameters. It had the lowest average AUC of the four.§3.1
- Llama-3.1-8b-Instruct
- An open model from Meta with 8 billion parameters, run on the authors' own GPU.§3.1
- XGBoost
- A standard tree-based learner. The paper trains it with labels as a stand-in for the best score a task allows, and also uses it to predict AUC from risk scores.§4.1
- acspubcov
- A US Census survey dataset (the ACSPublicCoverage task from folktables). The task: predict public health coverage.App. A.1